CGPACK > MAY-2016
Jump directly to: 4-MAY-2016 | 9-MAY-2016 | 12-MAY-2016 | 13-MAY-2016 | 15-MAY-2016 | 17-MAY-2016 | 19-MAY-2016 | 20-MAY-2016 | 23-MAY-2016
4-MAY-2016: Can now get MPI calls with TAU
It turned out I was not linking correctly against TAU libraries. Fixed in r84 of coarrays, example problem 5pi, see Makefile.
Anyway, I also rebuilt TAU like this:
./configure -mpi -c++=mpiicpc -cc=mpiicc -fortran=mpiifort -pdt=$HOME/pdtoolkit-3.22 -bfd=download
Here are the validation
results.html.
Note that pprof now shows
MPI processes.
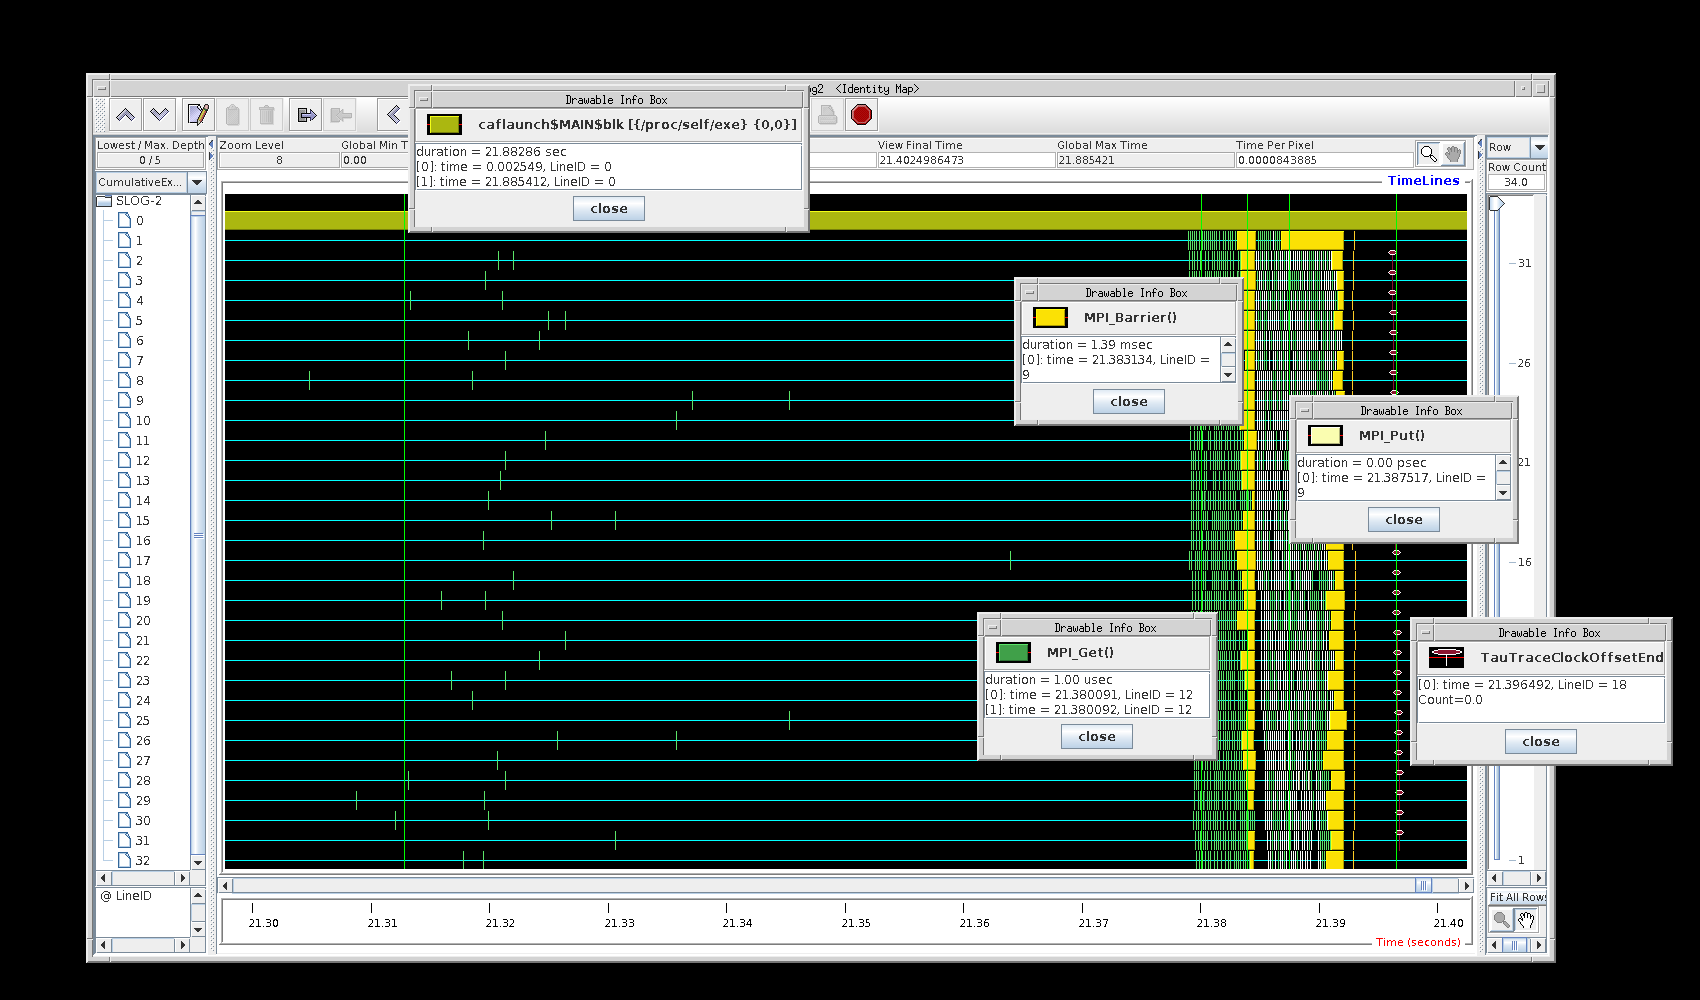
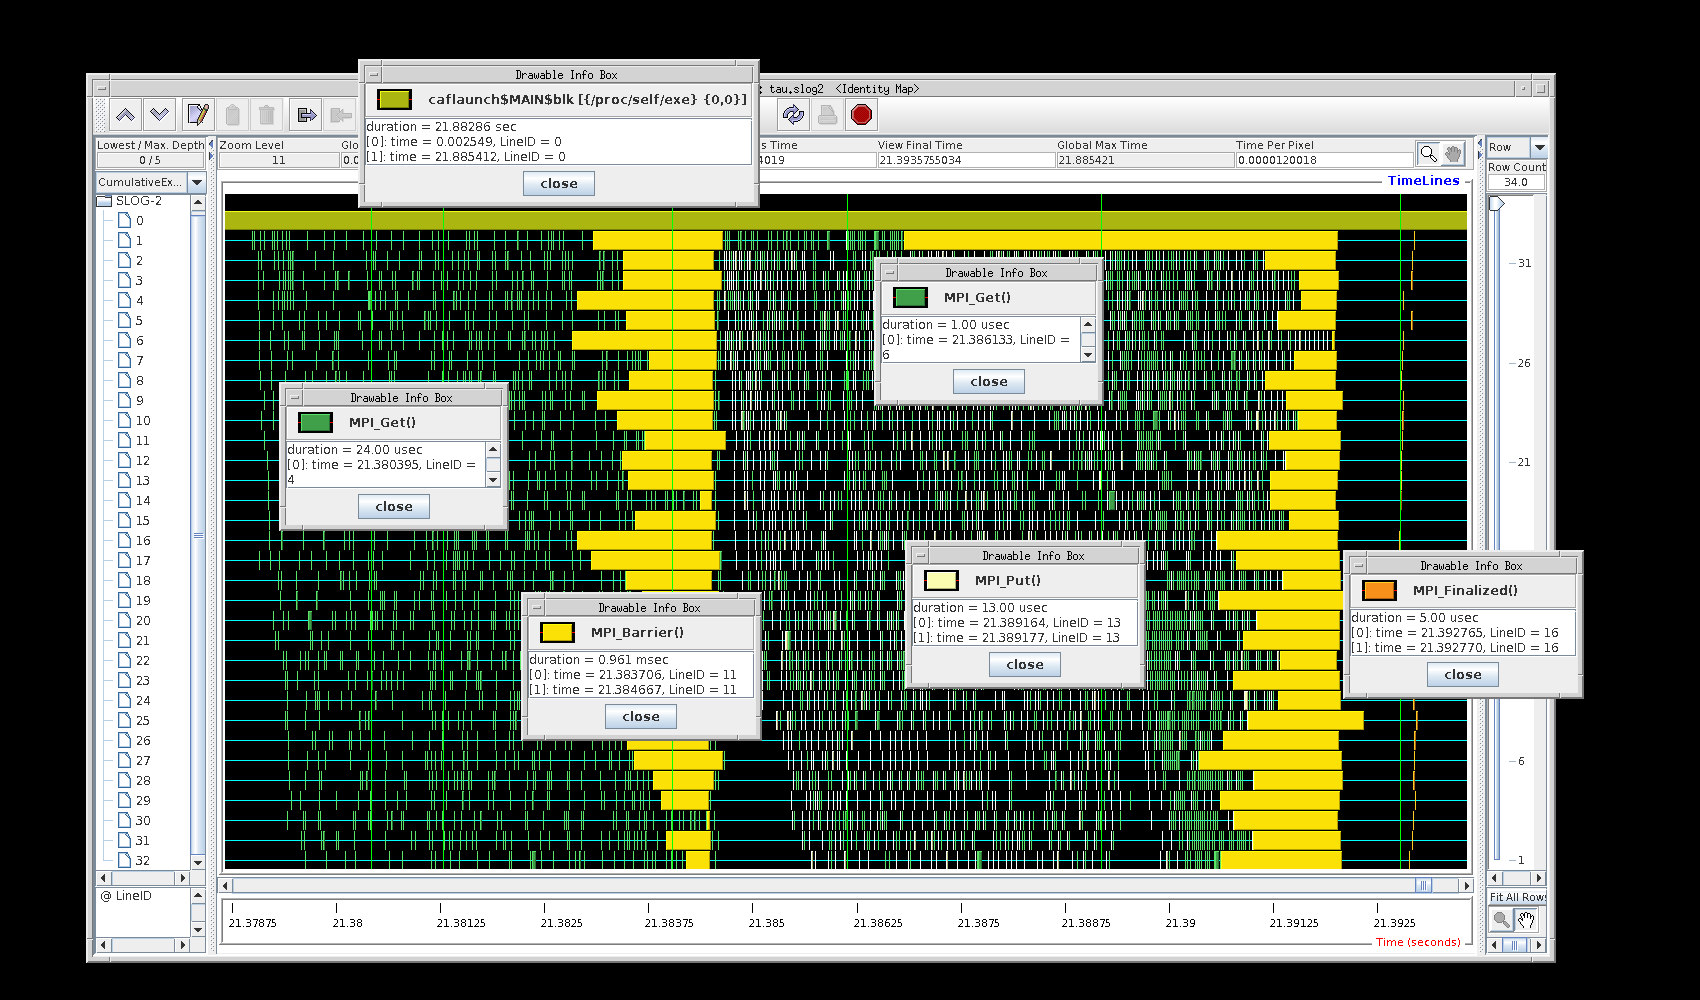
Some new results from jumpshot.
This is for 5pi on 32 images on a single 16-core node.
The MPI calls are now visible, but not the arrows.
Why?

Here is the pprof output:
pprof.text
And here are paraprof visualisations.
Note, as before, there is process 0, which just does
caflaunch.
Clearly the runtime is dominated by the pica
calculations.
Communications are negligible.
But now I have no hardware counters, because I built without PAPI. Let's try rebuilding once again with PAPI. Configure as:
./configure -mpi -c++=mpiicpc -cc=mpiicc -fortran=mpiifort -pdt=$HOME/pdtoolkit-3.22 -bfd=download -papi=/cm/shared/libraries/intel_build/papi-5.3.0
The validation results:
results2.html.
Moving on to the Laplace solver, problem 9laplace from the coarrays course.
Let's try
co_back2.f90
program, which implements
partitioning of the picture
(2D array) into chunks in two
dimensions.
I run it on 4 images, i.e.
splitting into 4 chunks, -
2 along dimension 1 and
2 chunks along dimension 2.
Note that images 1 and 2 spend less on computation,
coback2 (red)
and more on MPI_barrier (orange)
compared to images 3 and 4.
I don't know why this is or whether this is
significant.
This is for image 2.
Note image 2 spends less time computing and more time waiting,
MPI_barrier, compared to image 3.
This is for image 3.
Note image 3 spends more time computing and less time waiting,
MPI_barrier, compared to image 2.
Finally, here's the plain text output of pprof:
9lap-pprof.text.
9-MAY-2016: Trying to understand very poor speed-up of parallel Laplacian solver.
This is example problem 9laplace from the Coarrays Course.
Let's try a much bigger image, in case the problem is that there is not enough work for each image to do at each iteration, and the global sync overheads dominate the runtime.
12-MAY-2016: Some progress with Intel
I switched to a 600x400 image:
$ identify ref.pgm
ref.pgm PNM 600x400 600x400+0+0 8-bit Grayscale DirectClass 793kb
I use full ifort optimisation and collect opt. reports:
-fast -qopt-report
The serial back.f90 runs under a minute:
45.68user 0.11system 0:45.92elapsed 99%CPU (0avgtext+0avgdata 19248maxresident)k
64inputs+1600outputs (1major+1274minor)pagefaults 0swaps
I was having some Intel MPI errors. In the Intel Clusters and HPC Technology forum Intel staff asked for the output of:
export confile=nodes
cat $PBS_NODEFILE > $confile

mpirun -genvall -genv I_MPI_FABRICS shm:dapl -genv I_MPI_HYDRA_DEBUG 1 -n 16 -machinefile ./nodes IMB-MPI1
which is under
9lap.o4579303.
Might be useful in future for debug.
Now trying a coarray program coback1.f90.
This version is not instrumented.
coback1-tau.f90 is instrumented.
The programs differ only in one line - the instrumented
program, coback1-tau.f90, calls this TAU routine:
call TAU_PROFILE_SET_NODE(this_image())
The program splits the 2D picture array along dimension 2, so that the coarrays are long along dimension 1 (fastest changing) and short along dimension 2 (slow changing). The picture size is 400 along dimension 2, which is divisible by 2, 4, 8, 10, 16, 20, 25 and 40. Hence I use these numbers of images in this example. The uninstrumented run times are:
===> coback1.x
-genvall -genv I_MPI_FABRICS=shm:dapl -machinefile ./nodes -n 2 ./coback1.x
150.53user 12.12system 1:36.55elapsed 168%CPU (0avgtext+0avgdata 37904maxresident)k
1528inputs+1616outputs (2major+8435minor)pagefaults 0swaps
===> coback1.x
-genvall -genv I_MPI_FABRICS=shm:dapl -machinefile ./nodes -n 4 ./coback1.x
220.00user 34.39system 1:05.75elapsed 386%CPU (0avgtext+0avgdata 42592maxresident)k
0inputs+1616outputs (0major+13983minor)pagefaults 0swaps
===> coback1.x
-genvall -genv I_MPI_FABRICS=shm:dapl -machinefile ./nodes -n 8 ./coback1.x
271.20user 78.84system 0:46.67elapsed 750%CPU (0avgtext+0avgdata 59536maxresident)k
0inputs+1608outputs (0major+30295minor)pagefaults 0swaps
===> coback1.x
-genvall -genv I_MPI_FABRICS=shm:dapl -machinefile ./nodes -n 10 ./coback1.x
249.17user 89.83system 0:39.64elapsed 855%CPU (0avgtext+0avgdata 65568maxresident)k
0inputs+5640outputs (0major+33616minor)pagefaults 0swaps
===> coback1.x
-genvall -genv I_MPI_FABRICS=shm:dapl -machinefile ./nodes -n 16 ./coback1.x
473.93user 202.38system 0:51.63elapsed 1309%CPU (0avgtext+0avgdata 85680maxresident)k
0inputs+1616outputs (0major+59846minor)pagefaults 0swaps
===> coback1.x
-genvall -genv I_MPI_FABRICS=shm:dapl -machinefile ./nodes -n 20 ./coback1.x
484.81user 191.53system 0:53.82elapsed 1256%CPU (0avgtext+0avgdata 89792maxresident)k
0inputs+1608outputs (0major+57515minor)pagefaults 0swaps
===> coback1.x
-genvall -genv I_MPI_FABRICS=shm:dapl -machinefile ./nodes -n 25 ./coback1.x
477.85user 194.95system 0:53.65elapsed 1254%CPU (0avgtext+0avgdata 95456maxresident)k
0inputs+1608outputs (0major+63444minor)pagefaults 0swaps
===> coback1.x
-genvall -genv I_MPI_FABRICS=shm:dapl -machinefile ./nodes -n 40 ./coback1.x
489.88user 446.08system 1:48.09elapsed 865%CPU (0avgtext+0avgdata 131168maxresident)k
0inputs+5664outputs (0major+96911minor)pagefaults 0swaps
The instrumented run times are:
===> coback1-tau.xtau
-genvall -genv I_MPI_FABRICS=shm:dapl -machinefile ./nodes -n 2 ./coback1-tau.xtau
173.92user 16.97system 1:55.10elapsed 165%CPU (0avgtext+0avgdata 64384maxresident)k
1592inputs+540304outputs (2major+13253minor)pagefaults 0swaps
===> coback1-tau.xtau
-genvall -genv I_MPI_FABRICS=shm:dapl -machinefile ./nodes -n 4 ./coback1-tau.xtau
246.27user 33.25system 1:12.43elapsed 385%CPU (0avgtext+0avgdata 69104maxresident)k
0inputs+1419664outputs (0major+22285minor)pagefaults 0swaps
===> coback1-tau.xtau
-genvall -genv I_MPI_FABRICS=shm:dapl -machinefile ./nodes -n 8 ./coback1-tau.xtau
302.14user 71.45system 0:50.69elapsed 736%CPU (0avgtext+0avgdata 85936maxresident)k
0inputs+3586704outputs (0major+45537minor)pagefaults 0swaps
===> coback1-tau.xtau
-genvall -genv I_MPI_FABRICS=shm:dapl -machinefile ./nodes -n 10 ./coback1-tau.xtau
294.58user 72.00system 0:46.36elapsed 790%CPU (0avgtext+0avgdata 91968maxresident)k
0inputs+4711504outputs (0major+57447minor)pagefaults 0swaps
===> coback1-tau.xtau
-genvall -genv I_MPI_FABRICS=shm:dapl -machinefile ./nodes -n 16 ./coback1-tau.xtau
567.49user 163.53system 1:02.69elapsed 1165%CPU (0avgtext+0avgdata 112128maxresident)k
0inputs+7984424outputs (0major+89060minor)pagefaults 0swaps
===> coback1-tau.xtau
-genvall -genv I_MPI_FABRICS=shm:dapl -machinefile ./nodes -n 20 ./coback1-tau.xtau
594.59user 172.27system 1:08.11elapsed 1125%CPU (0avgtext+0avgdata 116208maxresident)k
0inputs+8630880outputs (0major+94834minor)pagefaults 0swaps
===> coback1-tau.xtau
-genvall -genv I_MPI_FABRICS=shm:dapl -machinefile ./nodes -n 25 ./coback1-tau.xtau
601.58user 174.49system 1:07.08elapsed 1156%CPU (0avgtext+0avgdata 121904maxresident)k
0inputs+8450952outputs (0major+92624minor)pagefaults 0swaps
===> coback1-tau.xtau
-genvall -genv I_MPI_FABRICS=shm:dapl -machinefile ./nodes -n 40 ./coback1-tau.xtau
693.98user 436.61system 2:04.40elapsed 908%CPU (0avgtext+0avgdata 157520maxresident)k
0inputs+13701584outputs (0major+139719minor)pagefaults 0swaps
This is roughly the expected pattern. The best times are with 10 images in both cases. The instrumented times are slightly higher. However, even the best uninstrumented time is only marginally better than the serial time. Let's examine the profiling results from the run with 10 images.
The text results, sorted by exclusive total time, i.e.
pprof -m > pprof-10images
are in pprof-10images
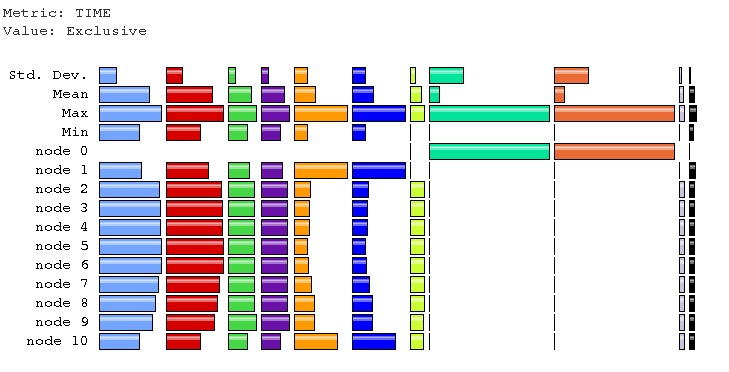
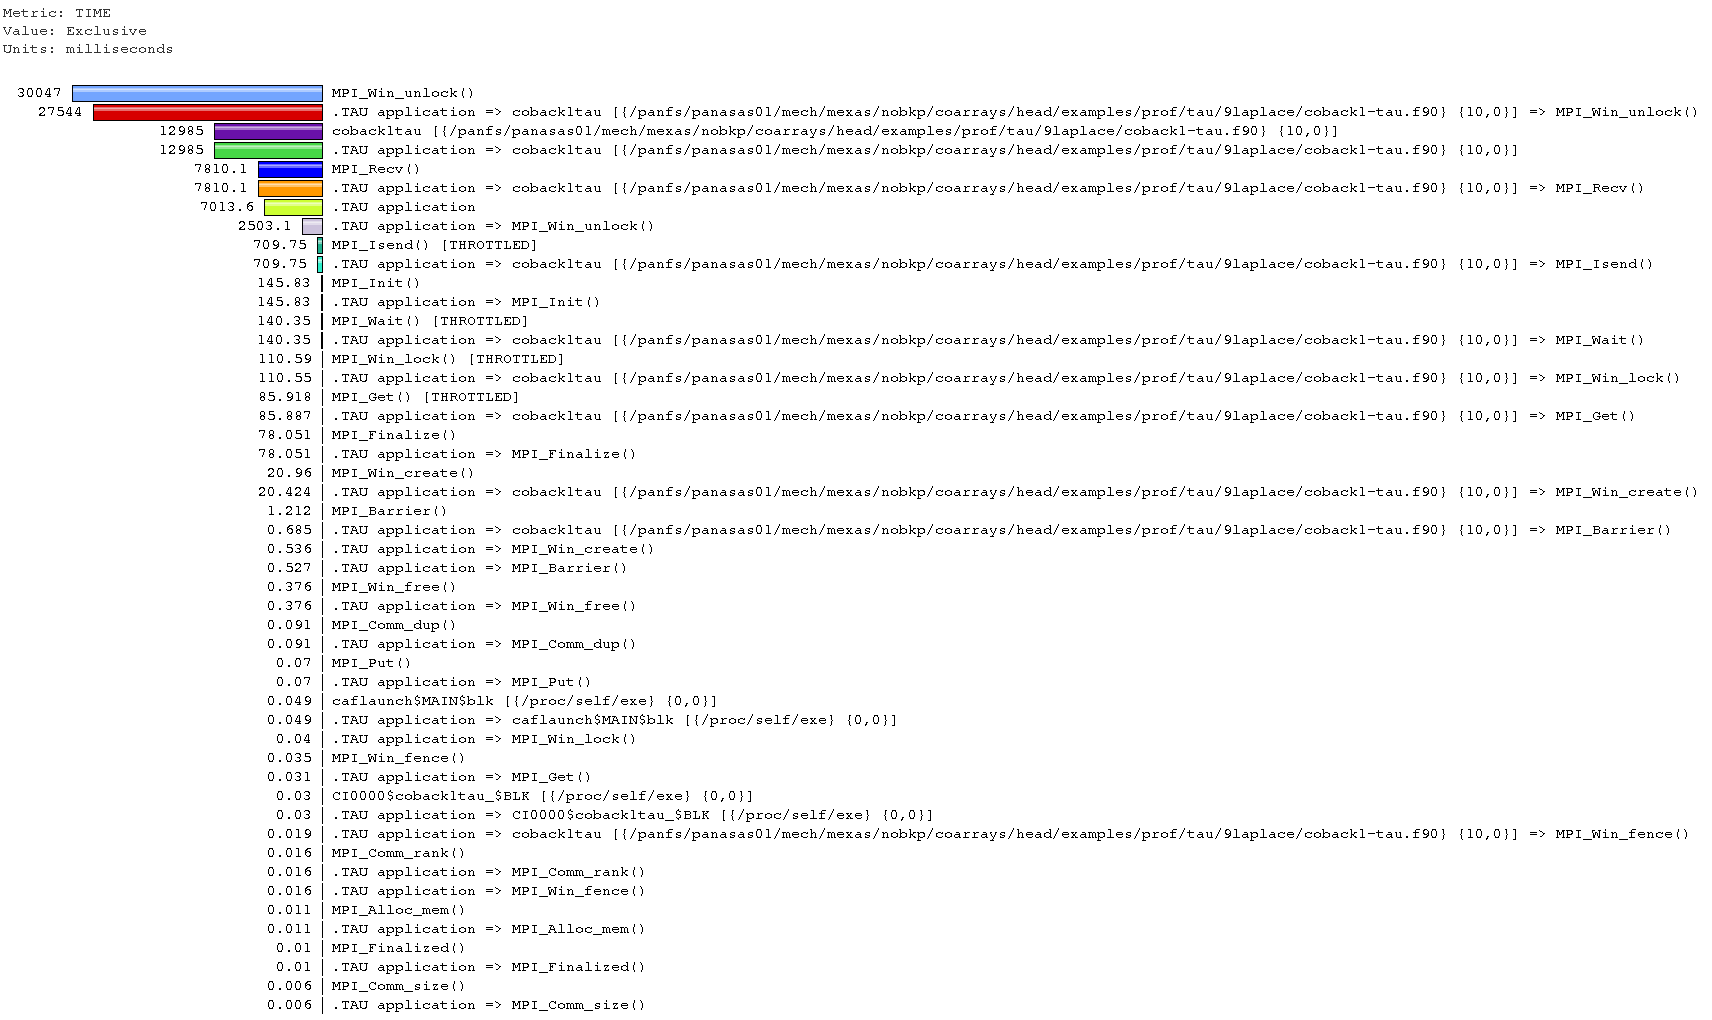
On most images MPI_Win_unlock takes most time.
This is clearly bad.
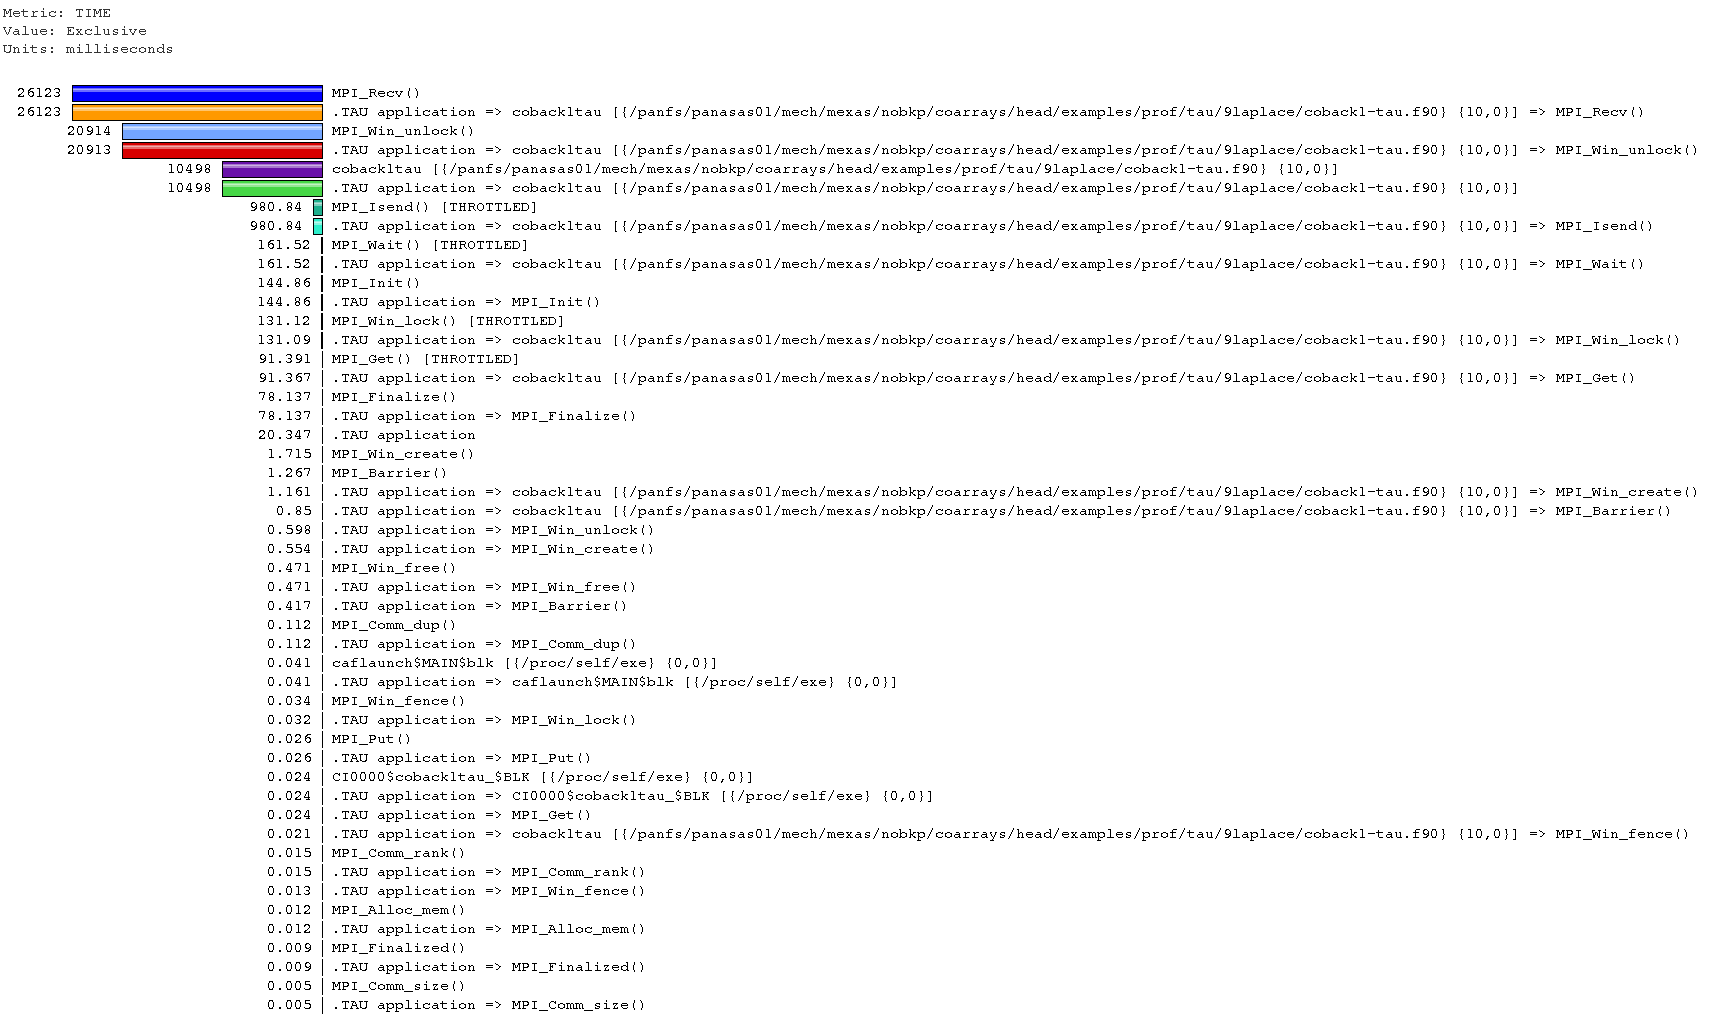
On the first and the last images MPI_Recv
takes most time, closely followed by MPI_Win_unlock.
The main paraprof window. Note the differences between images (nodes) 1 and 10, and the other images.
View on node (image) 3:
View on node (image) 1:
Conclusion - something is not very well optimised in MPI comms.
It would be interesting to know exactly how sync images
is mapped onto MPI calls.
Perhaps jumpshot can help.
I'll try this next.
13-MAY-2016: Jumpshot4 analysis of the Laplacian solver with Intel coarrays.
I concentrate on the behaviour towards the end of the program.
Here it seems all images, but image 1, have completed their
computations at about 49 s.
After that, for another 10s! they seem to be doing
mostly MPI_Win_unlock.
Why??
Also note - lighter green is coback1tau, the
main program.
Somehow it is not shown on node 10, even though the
profiling results,
pprof.text,
show it's there:
NODE 10;CONTEXT 0;THREAD 0:
---------------------------------------------------------------------------------------
%Time    Exclusive    Inclusive       #Call      #Subrs  Inclusive Name
              msec   total msec                          usec/call
---------------------------------------------------------------------------------------
 35.9       21,261       21,261      180000           0        118 .TAU application => coback1tau => MPI_Recv()
 35.9       21,261       21,261      180000           0        118 MPI_Recv()
 33.6       19,880       19,880 1.65962E+06           0         12 MPI_Win_unlock()
 29.1       17,183       17,183      900093           0         19 .TAU application => coback1tau => MPI_Win_unlock()
 83.5        9,819       49,407           1 1.48008E+06   49407127 .TAU application => coback1tau
 83.5        9,819       49,407           1 1.48008E+06   49407127 coback1tau
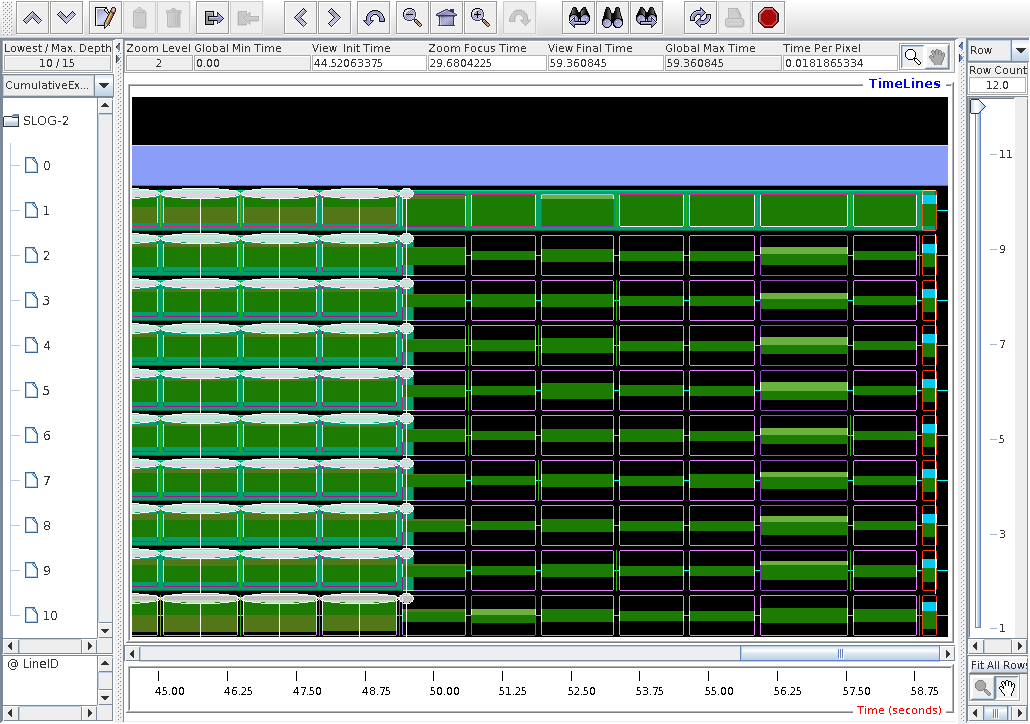
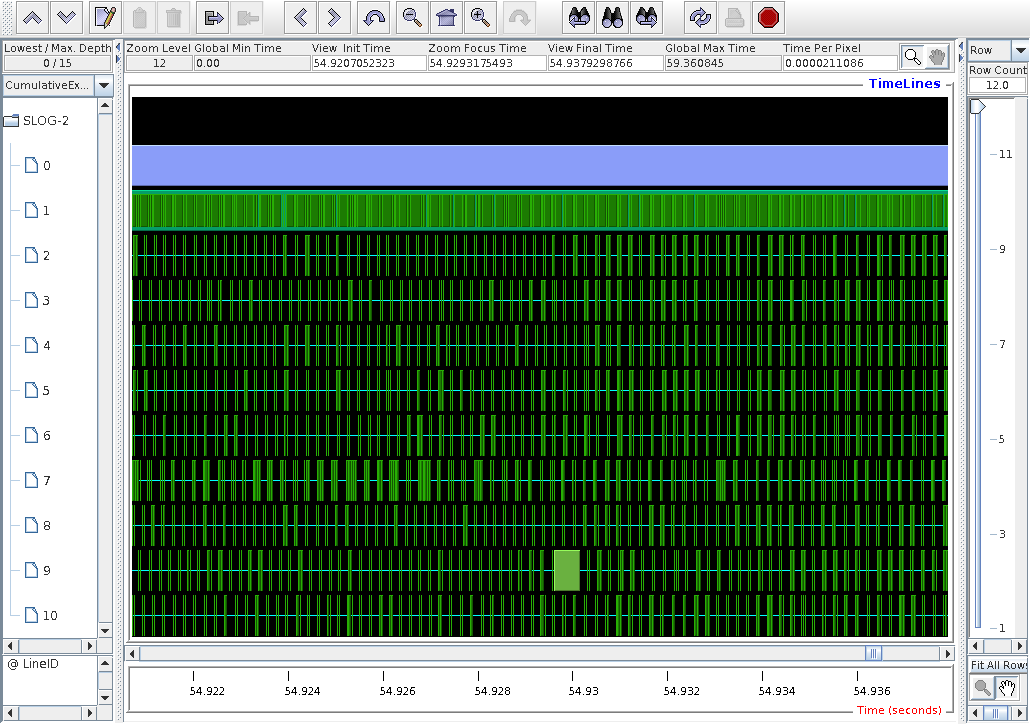
This is a high mag. fragment around 54.9s.
The dark green bars on images 1-10 are MPI_Win_unlock.
The lighter green on image 1 is coback1tau,
the main program.
The lavender on node 0 is caflaunch.
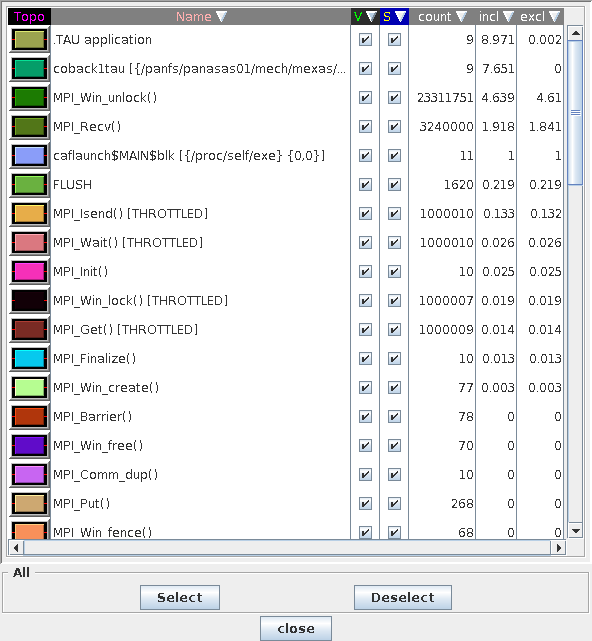
Here is the top of the legend, sorted by inclusive time.
I still can't get paraprof 3D views working from FreeBSD, get these errors:
 paraprof
javax.media.opengl.GLException: Error making context current
        at com.sun.opengl.impl.x11.X11GLContext.makeCurrentImpl(X11GLContext.java:141)
        at com.sun.opengl.impl.x11.X11OnscreenGLContext.makeCurrentImpl(X11OnscreenGLContext.java:69)
        at com.sun.opengl.impl.GLContextImpl.makeCurrent(GLContextImpl.java:127)
        at com.sun.opengl.impl.GLDrawableHelper.invokeGL(GLDrawableHelper.java:182)
        at javax.media.opengl.GLCanvas.maybeDoSingleThreadedWorkaround(GLCanvas.java:258)
        at javax.media.opengl.GLCanvas.display(GLCanvas.java:130)
        at javax.media.opengl.GLCanvas.paint(GLCanvas.java:142)
        at sun.awt.RepaintArea.paintComponent(RepaintArea.java:264)
        at sun.awt.X11.XRepaintArea.paintComponent(XRepaintArea.java:73)
        at sun.awt.RepaintArea.paint(RepaintArea.java:240)
        at sun.awt.X11.XComponentPeer.handleEvent(XComponentPeer.java:694)
        at java.awt.Component.dispatchEventImpl(Component.java:4725)
        at java.awt.Component.dispatchEvent(Component.java:4475)
        at java.awt.EventQueue.dispatchEventImpl(EventQueue.java:675)
        at java.awt.EventQueue.access$300(EventQueue.java:96)
        at java.awt.EventQueue$2.run(EventQueue.java:634)
        at java.awt.EventQueue$2.run(EventQueue.java:632)
        at java.security.AccessController.doPrivileged(Native Method)
        at java.security.AccessControlContext$1.doIntersectionPrivilege(AccessControlContext.java:108)
        at java.security.AccessControlContext$1.doIntersectionPrivilege(AccessControlContext.java:119)
        at java.awt.EventQueue$3.run(EventQueue.java:648)
        at java.awt.EventQueue$3.run(EventQueue.java:646)
        at java.security.AccessController.doPrivileged(Native Method)
        at java.security.AccessControlContext$1.doIntersectionPrivilege(AccessControlContext.java:108)
        at java.awt.EventQueue.dispatchEvent(EventQueue.java:645)
        at java.awt.EventDispatchThread.pumpOneEventForFilters(EventDispatchThread.java:275)
        at java.awt.EventDispatchThread.pumpEventsForFilter(EventDispatchThread.java:200)
        at java.awt.EventDispatchThread.pumpEventsForHierarchy(EventDispatchThread.java:190)
        at java.awt.EventDispatchThread.pumpEvents(EventDispatchThread.java:185)
        at java.awt.EventDispatchThread.pumpEvents(EventDispatchThread.java:177)
        at java.awt.EventDispatchThread.run(EventDispatchThread.java:138)
So I tried from MS Windows 7(?), and it worked:
Note that there is an inconsistency in node/image numbering in TAU, resulting in non-symmetric comms matrix.
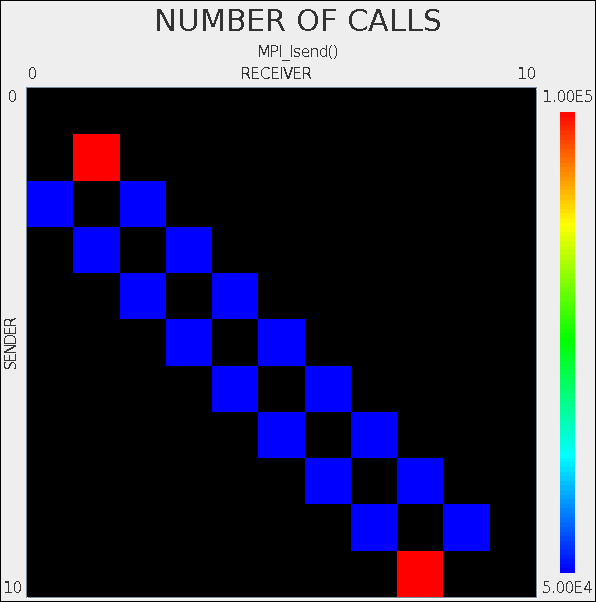
This is likely caused by the fact the coarrays are implemented over MPI. So in some places coarray Fortran 1 to N notation is used, and in other places C 0 to N-1 notation is used.
If I disable the TAU call to explicitly set the node number:
!call TAU_PROFILE_SET_NODE(this_image())
then the comms matrix looks like this:
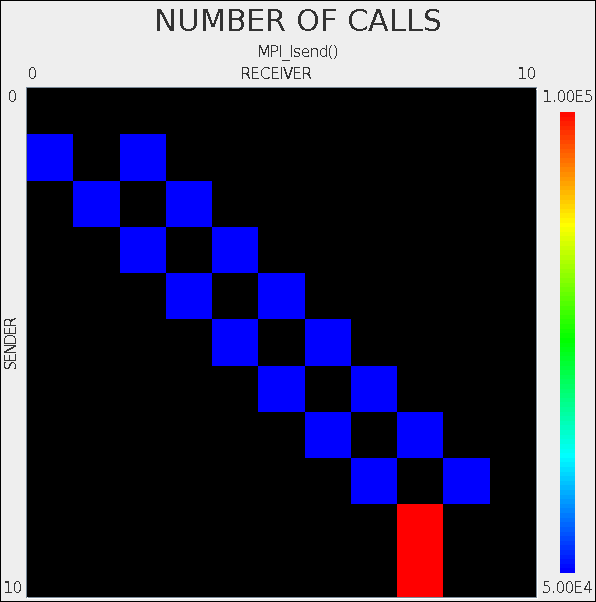
However, now the pprof results are
weird.
Only 10 nodes are shown (previously there was also 11th
node running caflaunch only).
And of the 10 nodes, only 9 are shown to do any useful work.
Node 1 now only runs caflaunch,
and only nodes 2-10 do useful work:
On the other hand I now finally get remote
calls shown with arrows in jumpshot4.
Preview mode.
Olive colour is TAU itself.
Lavender on node 0 is caflaunch.
Note that node 0 runs nothing else but caflaunch.
I'm not sure if this is correct, because
then it would mean that only 9 images are doing
useful work, not 10.
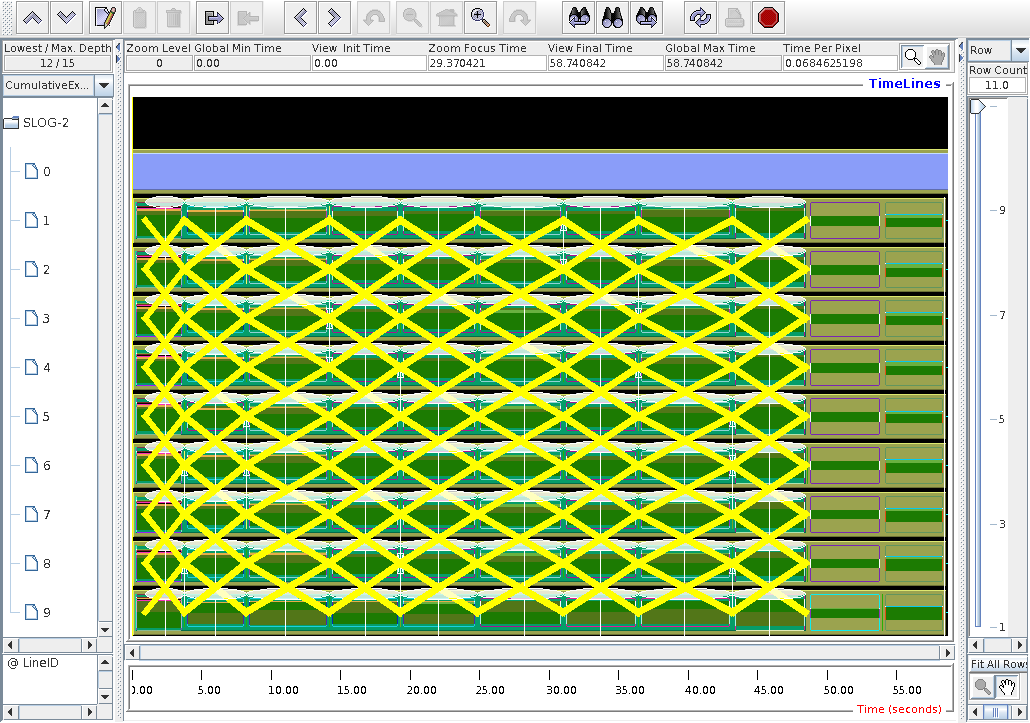
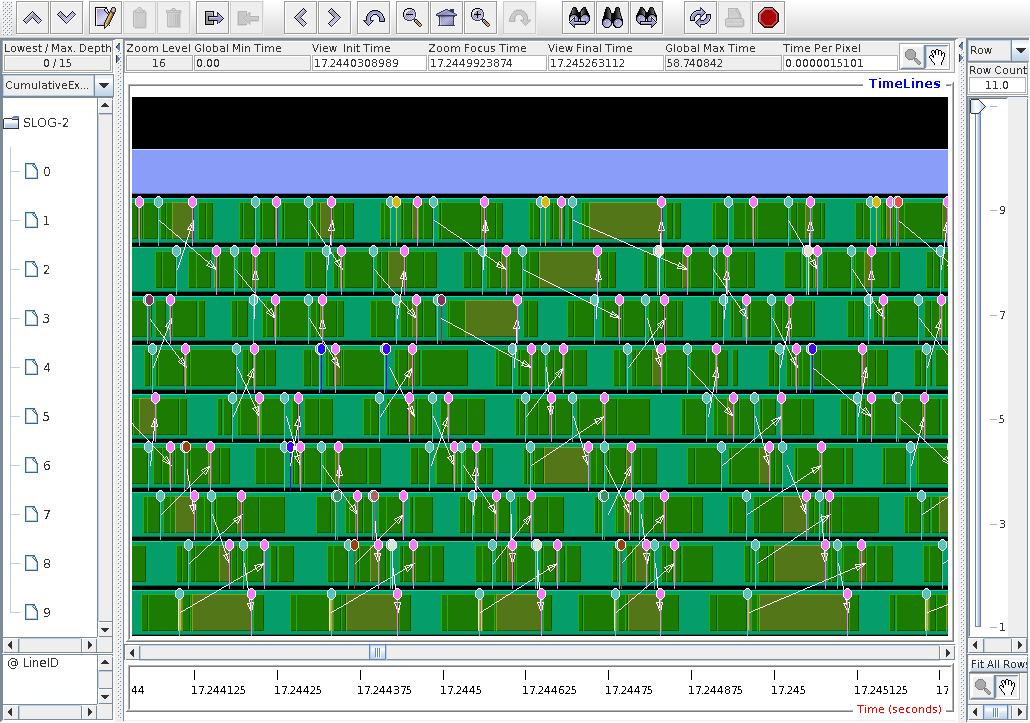
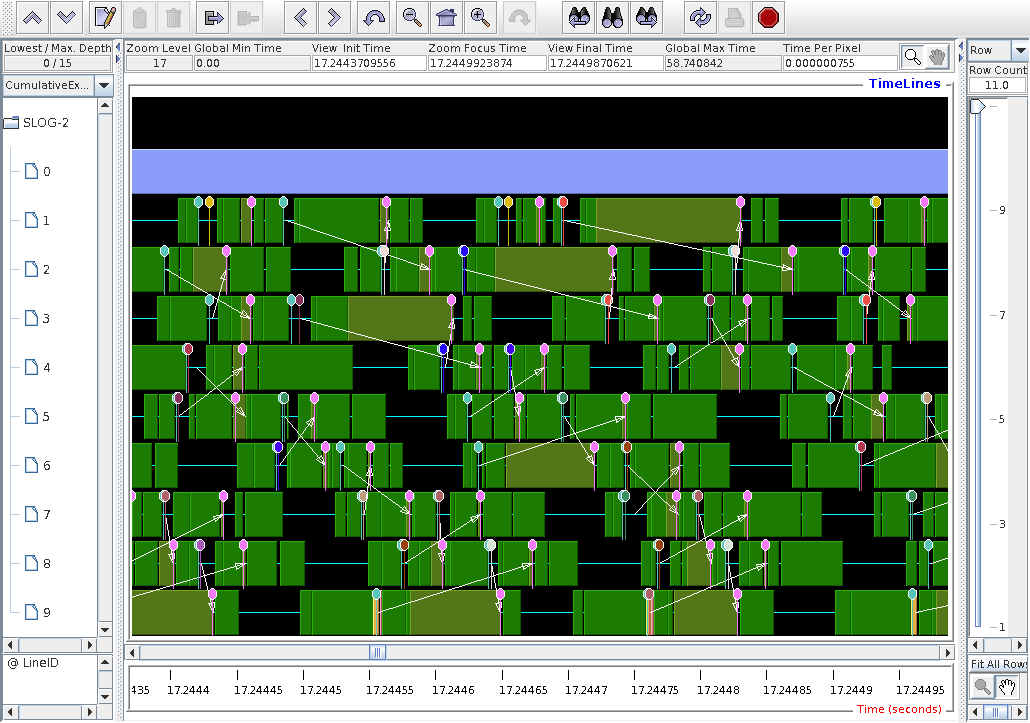
Individual remote comms are becoming visible at this magnification. The arrows show from which node to which node. The pins give the timestamp and the exact event.
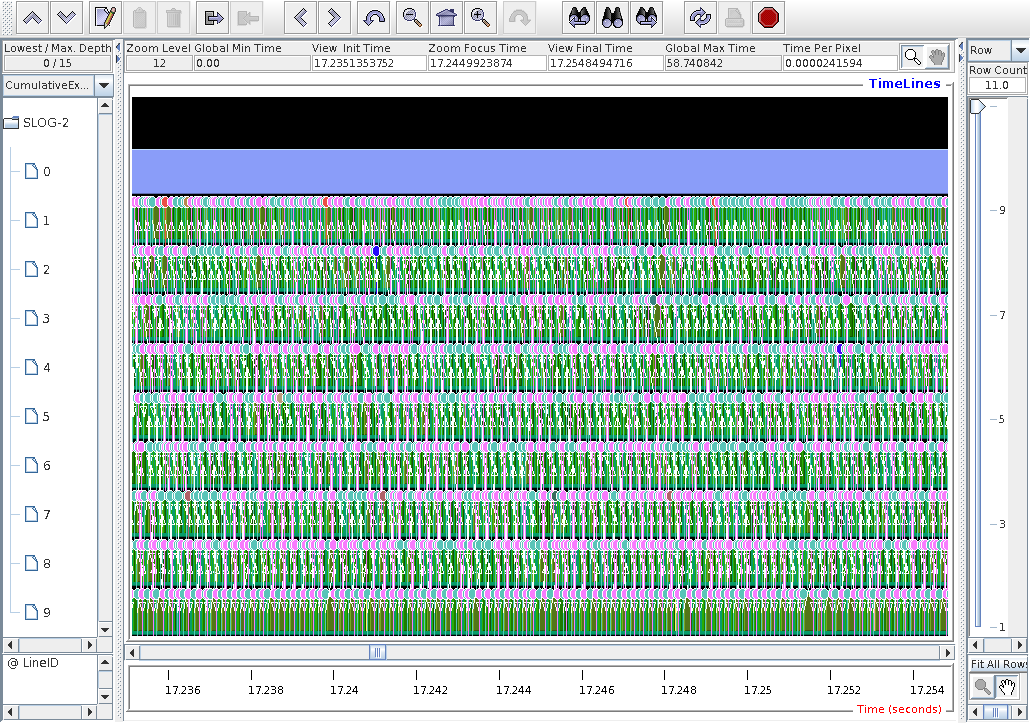
A pattern of communications now is visible.
Although sync images allows for
random comms pattern, it seems the comms start
from node 1, i.e. node 1 swaps halos with node 2.
The node 2 swaps halos with node 3, etc., until
nodel 9 swaps halos with node 8.
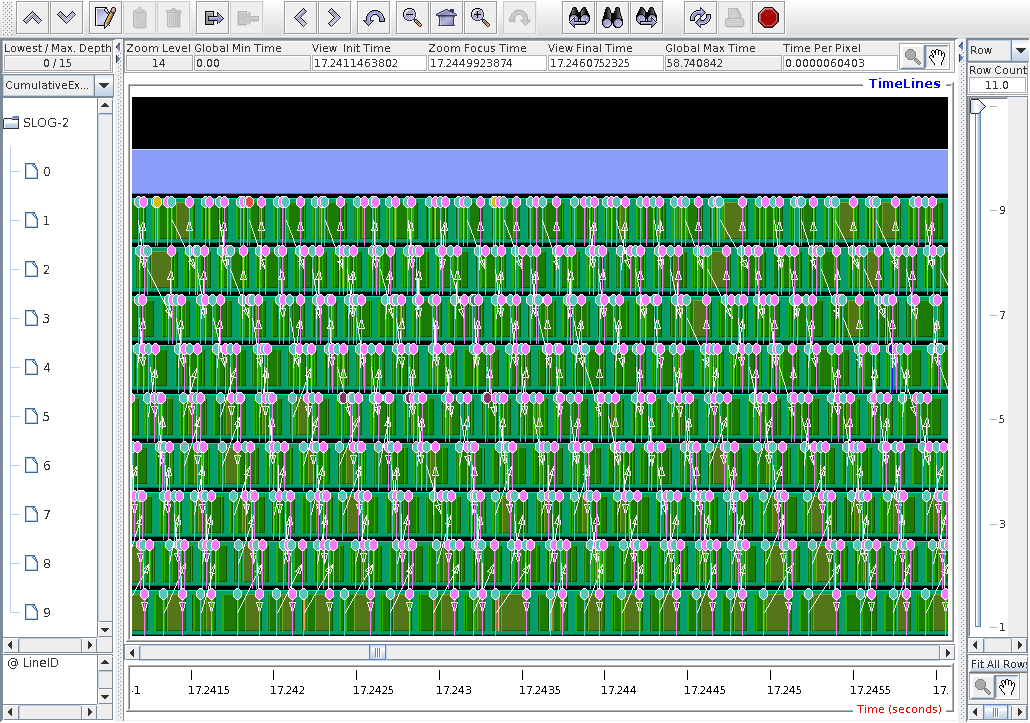
Some randomness in the duration of remote calls is now visible.
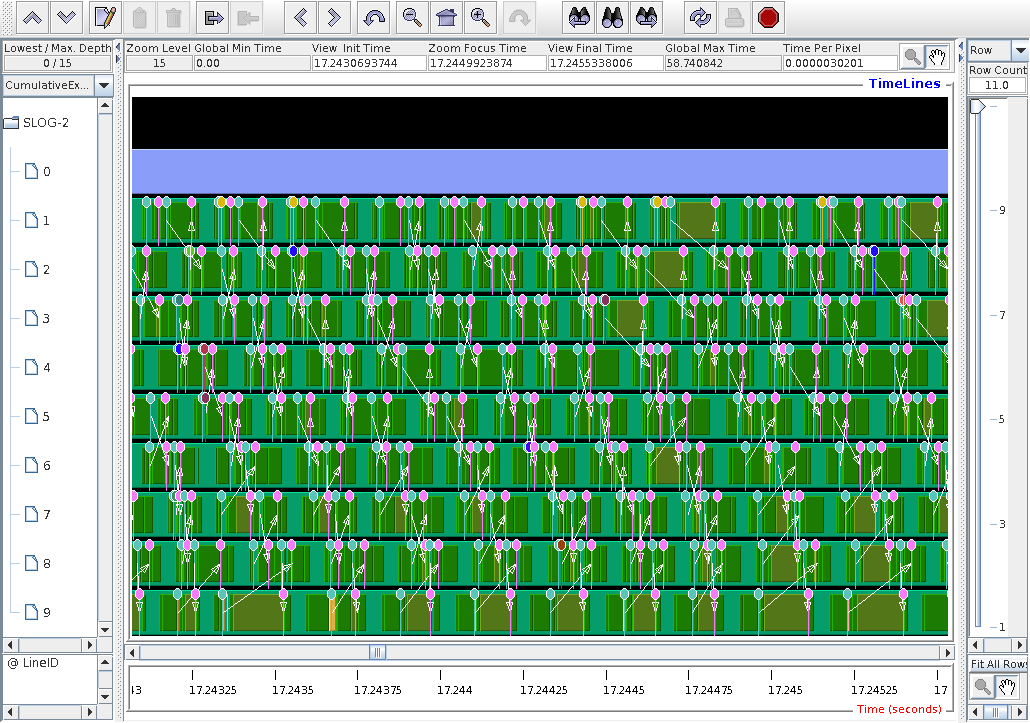
The pin names are: pink is "Message size received from all nodes"; blue is "Message size sent to node ..."; light green is "Message size is sent to all nodes". The other colours are the same messages shown from .TAU.
Here I removed the coback1tau process, the
main program, and the TAU process.
The green blocks are MPI_Win_unlock,
and the olive blocks are MPI_Recv.
Note that nothing is left on node 0, but caflaunch.
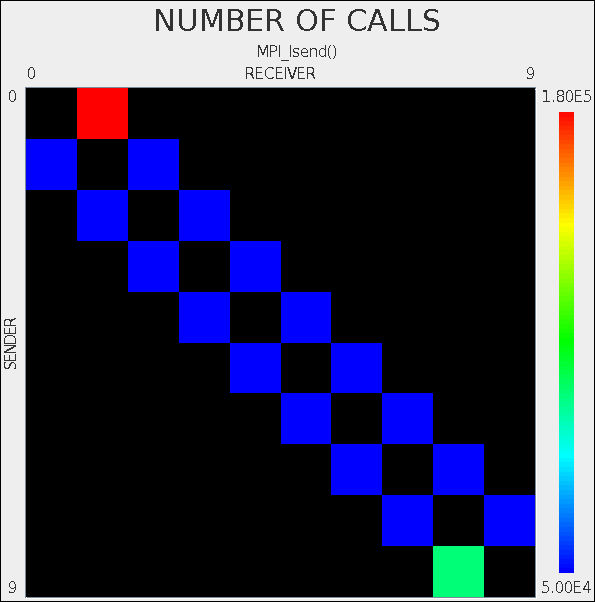
15-MAY-2016: Trying export TAU_PROFILE_FORMAT=merged
Following advice from Sameer Shende via TAU-users mailing list, I added
export TAU_PROFILE_FORMAT=merged
to the PBS job script. The comms matrix is finally symmetric, as it should be:
17-MAY-2016: Figured out how to run paraprof 3D
animation over ssh
paraprof is a shell script that sets up
some variables and then calls java.
One of the variables it sets is:
# If 3D window has problems, please uncomment
#if [ $MACHINE = bgq -o $MACHINE = arm_linux ]; then
export LIBGL_ALWAYS_INDIRECT=1
#fi
I commented LIBGL_ALWAYS_INDIRECT=1 out
and now I can run paraprof 3D GL animation
over ssh.
This post explains what setting of
LIBGL_ALWAYS_INDIRECT=1 does:
http://unix.stackexchange.com/questions/1437/what-does-libgl-always-indirect-1-actually-do.
The exact value is not important. Any value will be interpreted by GL as variable set. Indirect rendering means that the remote GL program sends GL commands over the net to be interpreted by the local GL library. Apparently, this doesn't work in my case. Probably some version clash. Unsetting this variable enables direct rendering, where GL on the remote host communicates directly with graphical hardware on the remote host and only the resulting frames are being sent over the net. This is slower, and at some frame rates might be unsuitable, but it avoids completely the compatibility problems between the local and remote GL versions or similar.
In my particular case the remote host doesn't seem to have dri:
libGL error: failed to open drm device: No such file or directory
libGL error: failed to load driver: i965
so Mesa is used instead.
Hitting GL Info button
in paraprof 3D animation window
shows this:

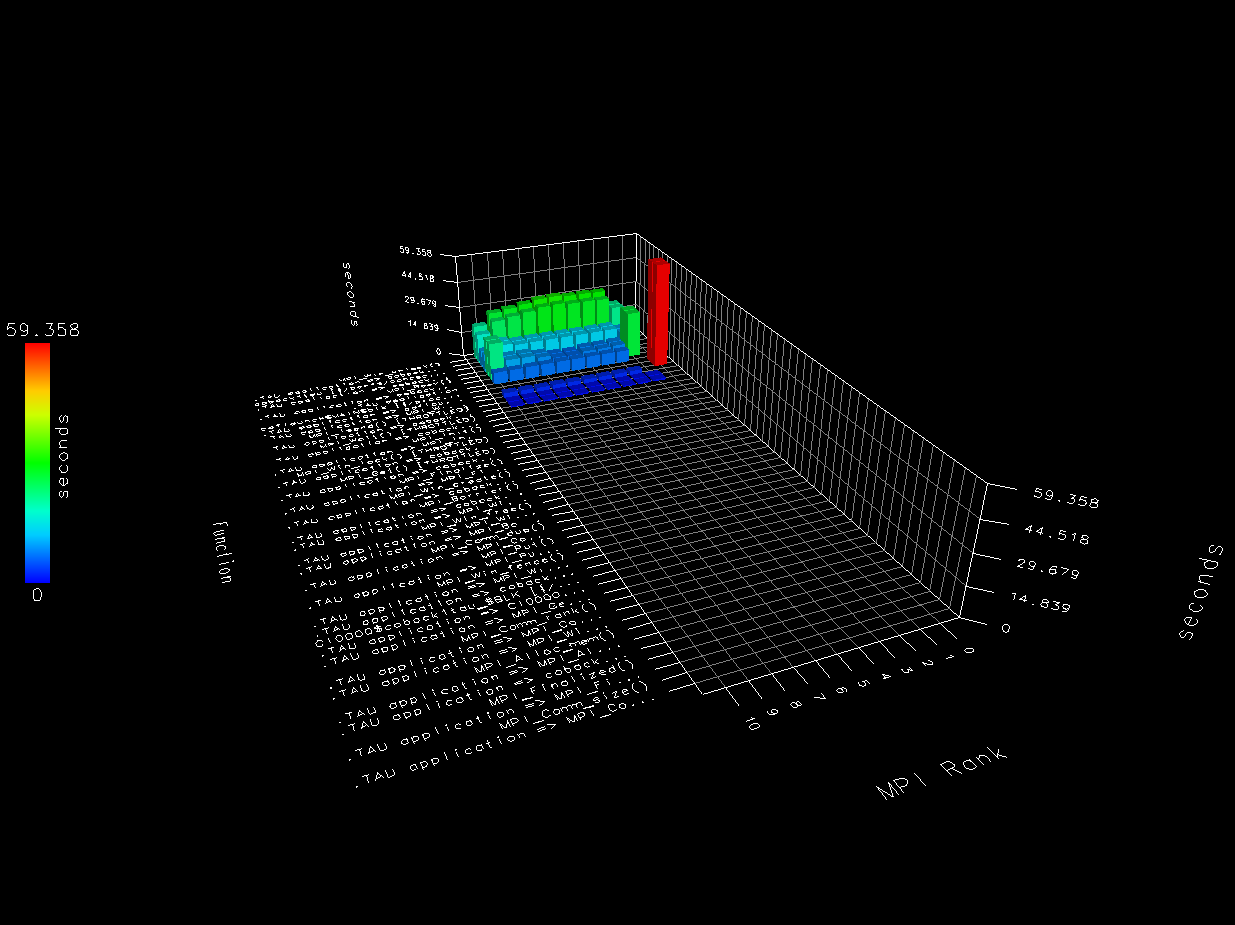
Here's the 3D paraprof bar chart
for
5pi
example, compiled for shared memory execution,
and run on 16 images, i.e. a single node.
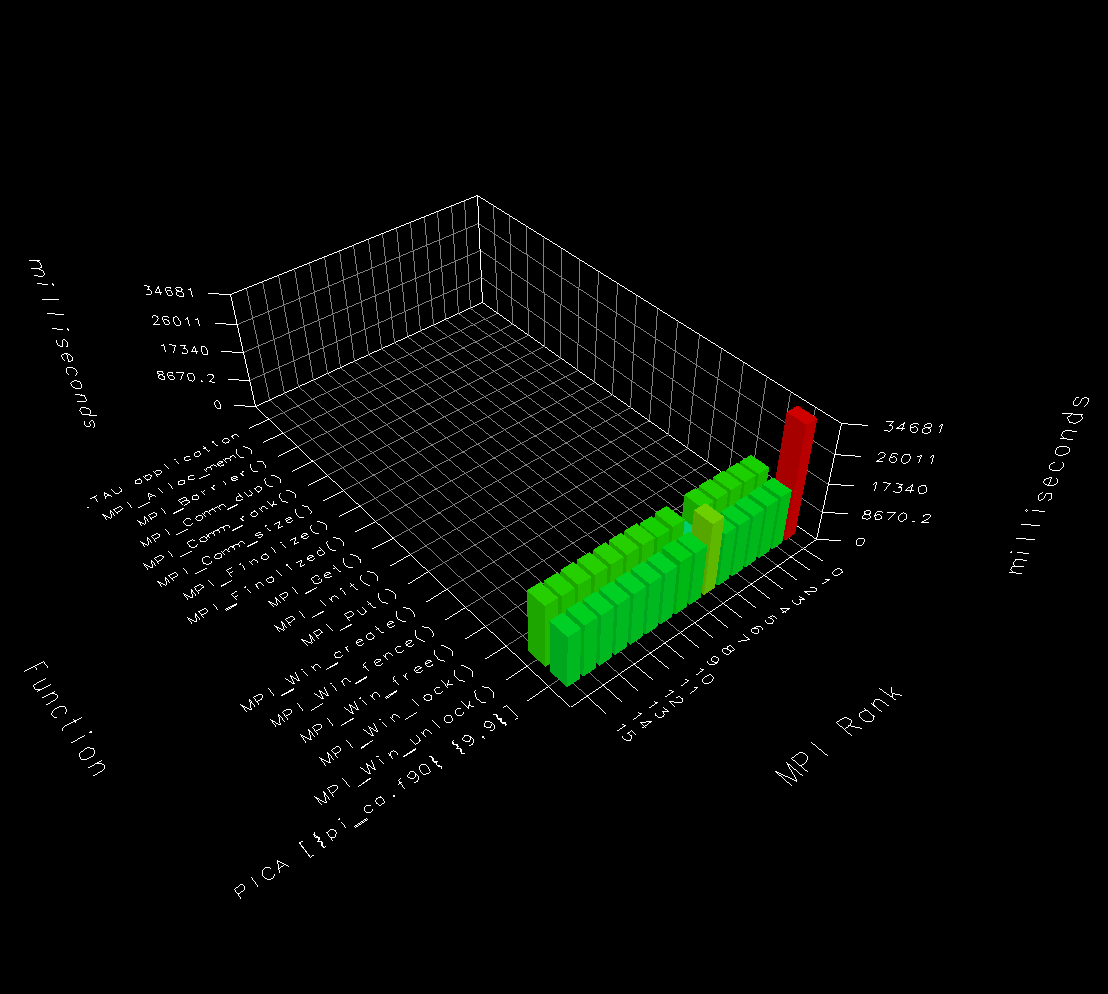
Node 0 (image 1) is most busy,
because it's doing the reduction operation.
This node also does not call MPI_Win_unlock.
Not sure if this is correct, or TAU misunderstanding.
Node 6 is slightly different from other nodes, but otherwise
the load is even.
Below is paraprof 3D bar chart for
9laplace
example, run on 10 images with distributed memory
on a single node.
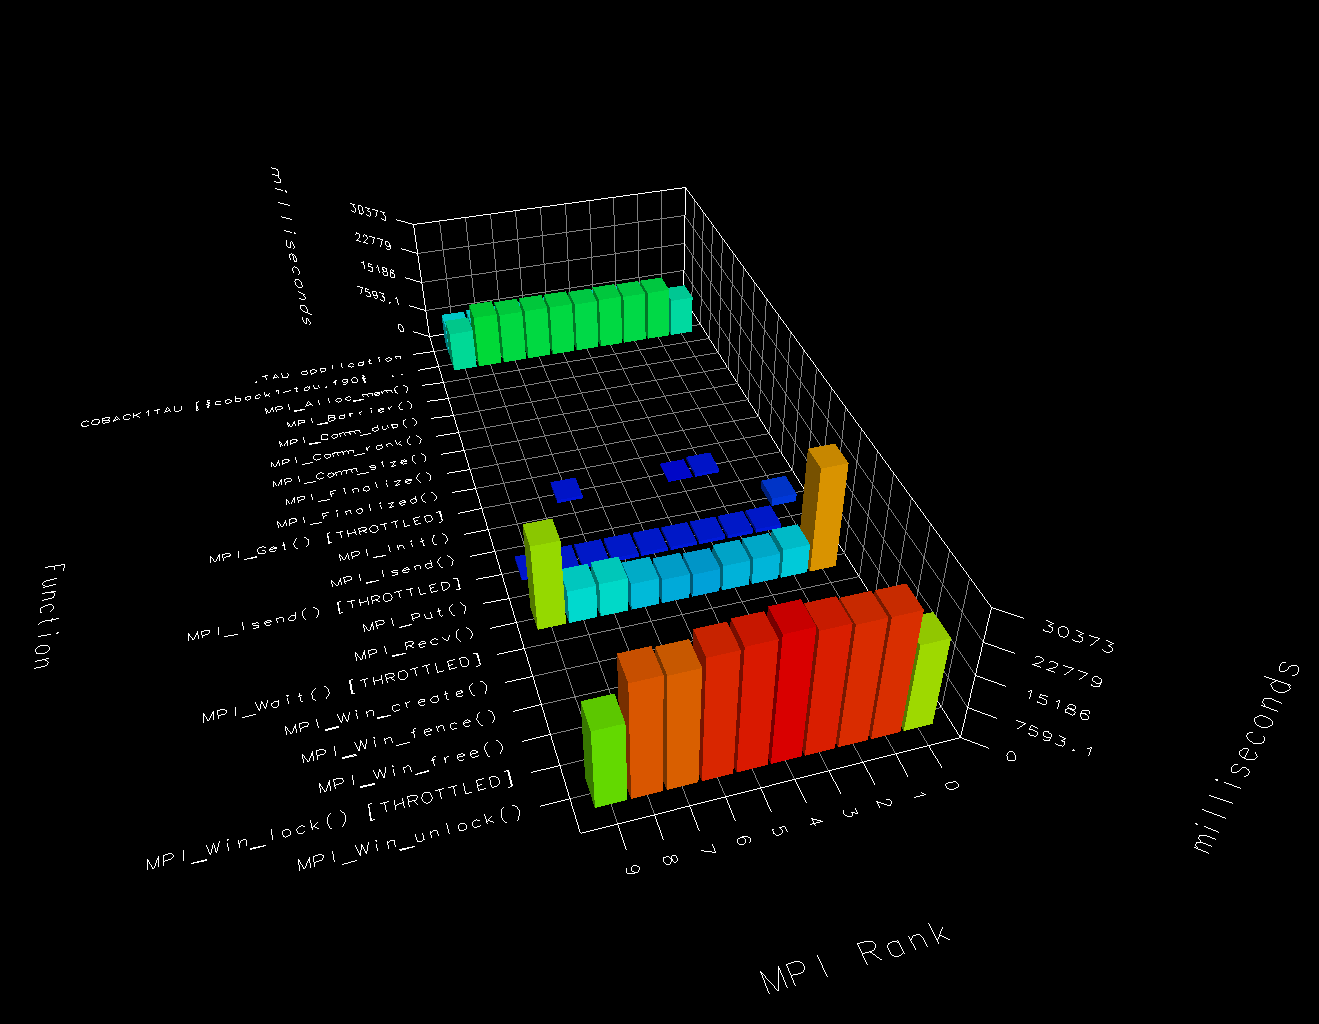
MPI_Win_unlock dominates the run time
here.
There is slight imbalance - nodes 0 and 9 (images 1 and 10)
spend more time doing comms and less time doing calculations.
It is interesting to note that
MPI_Recv take a lot more time than
MPI_Isend.
19-MAY-2016: Moving onto CGPACK examples
This is program
testABW.f90.
I instrument the library and the test programs
with identical tau-instrument.sh
driver script:
export TAU_OPTIONS="-optShared -optVerbose -optCompInst"
export TAU_MAKEFILE=$HOME/tau-2.25.1/x86_64/lib/Makefile.tau-icpc-papi-mpi-pdt

make clean -i -f Makefile-bc3-mpiifort-tau
make all -i -f Makefile-bc3-mpiifort-tau
If TAU option -optCompInst is not used,
then I get CGPACK build errors:
cgca_m3clvg.inst.f90(143): warning #6878: Within an interface block, this statement is ignored.
save profiler
------^
cgca_m3clvg.inst.f90(145): error #6622: This statement is invalid in an INTERFACE block.
call TAU_PROFILE_TIMER(profiler, '                                &
------^
cgca_m3clvg.inst.f90(148): error #6622: This statement is invalid in an INTERFACE block.
call TAU_PROFILE_START(profiler)
--------^
cgca_m3clvg.inst.f90(149): error #6622: This statement is invalid in an INTERFACE block.
call TAU_PROFILE_STOP(profiler)
--------^
cgca_m3clvg.inst.f90(142): warning #6168: Data initializations are ignored in interface blocks.
integer profiler(2) / 0, 0 /
^
compilation aborted for cgca_m3clvg.inst.f90 (code 1)
Error: Compilation Failed
Error: Command(Executable) is -- mpiifort
Error: Full Command attempted is -- mpiifort   -c -qopt-report -assume realloc_lhs -O2 -debug full -g -traceback -free -fPIC -warn -coarray=distributed -coarray-config-file=xx14.conf cgca_m3clvg.inst.f90   -I/panfs/panasas01/mech/mexas/tau-2.25.1/include -I/cm/shared/languages/Intel-Compiler-XE-16-U2/compilers_and_libraries_2016.2.181/linux/mpi/intel64/include  -I/panfs/panasas01/mech/mexas/tau-2.25.1/include -I/cm/shared/languages/Intel-Compiler-XE-16-U2/compilers_and_libraries_2016.2.181/linux/mpi/intel64/include     -o cgca_m3clvg.o
Here's the full build log:
cgpack-no-optCompInst.log
Apparently TAU calls are inserted by mistake into
interface block, where no calls can appear.
I reported this to
tau-users
mailing list.
It would be strange if this happened only
in coarray Fortran programs.
I suspect the use of submodules.
So, have to instrument with -optCompInst,
which, as described earlier on this page, leads to wrong TAU
profiling data on image 1 (node 0).
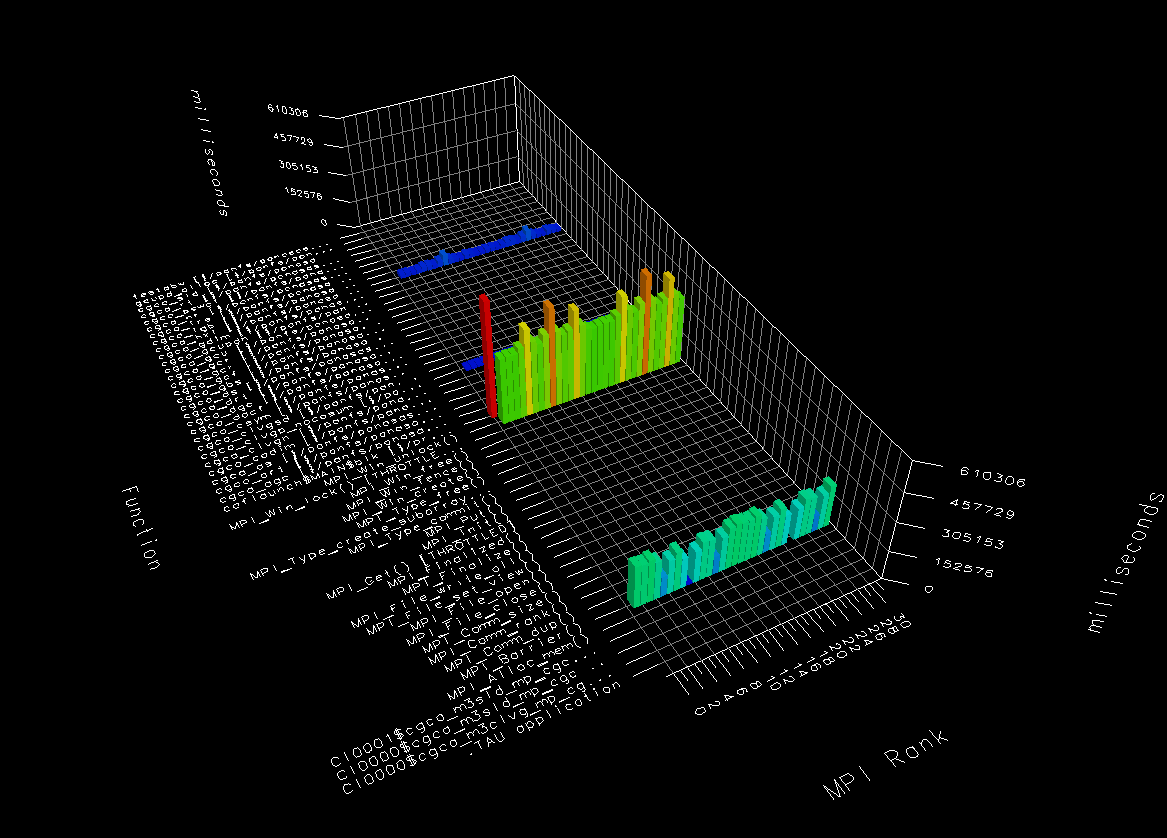
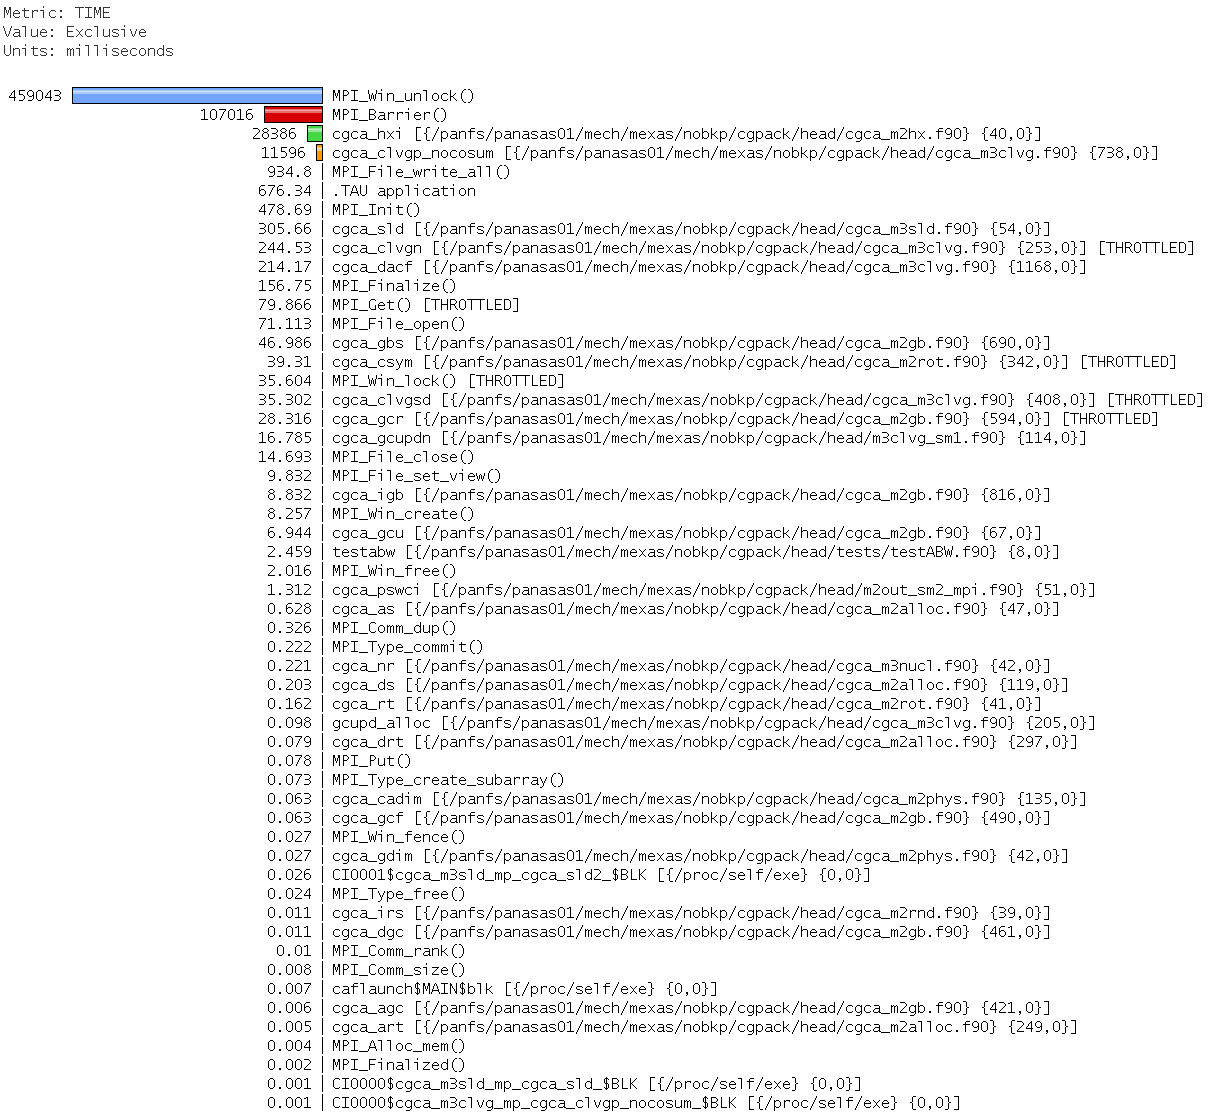
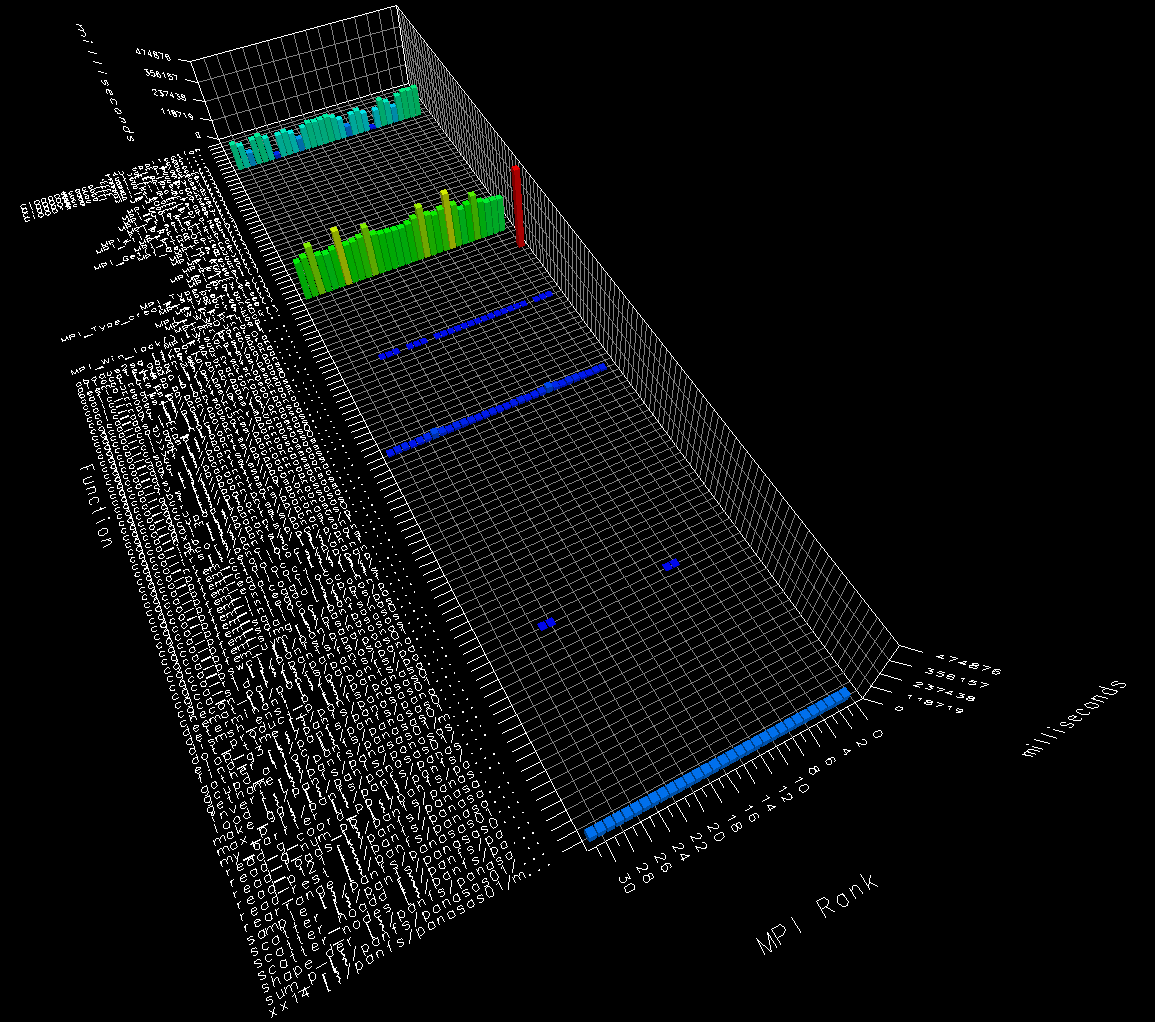
The 3 plots below tell the same story.
Run time is dominated by MPI_Win_unlock,
with MPI_Barrier in the second place.
Only 2 CGPACK routines break the 1% time threshold
to appear in the 3D bar chart -
cgca_hxi.f90
and
cgca_clvg_nocosum.
The trace is a bit boring, just an endless stream
of MPI_Win_unlock (olive), in this case
inside cgca_hxi (yellow).
20-MAY-2016: CGPACK+ParaFEM example
Managed to build ParaFEM with TAU by adding
export TAU_OPTIONS="-optShared -optVerbose -optCompInst"
export TAU_MAKEFILE=$HOME/tau-2.25.1/x86_64/lib/Makefile.tau-icpc-papi-mpi-pdt
to
make-parafem,
and changing only these 2 variables
in
build/bc3.inc:
FC=                   tau_f90.sh
BC3_FFLAGS=           -O2 -r8 -mt_mpi -warn all -stand f08 -traceback $(TAU_FLAGS)
I also disabled all other tests in make-parafem,
to speed the build up and to avoid unnecessary build errors:
BUILD_GROUP_XX="xx14"
Finally, I put tau.conf files in both
parafem/parafem dir, and in
parafem/parafem/src/programs/dev/xx14 dir.
Not sure if both copies are required, but this seems to work.
I tried only
xx14std.f90
program, where "std" stands for standard
conforming.
At this stage coarray collectives are not yet in
the standard, and more importantly, they are not yet
supported in Intel Fortran v. 16, so standard
conforming basically means no collectives.
xx14std.f90 does use MPI/IO though
to dump CA output.
The instumented program works fine, and here are the
TAU results.
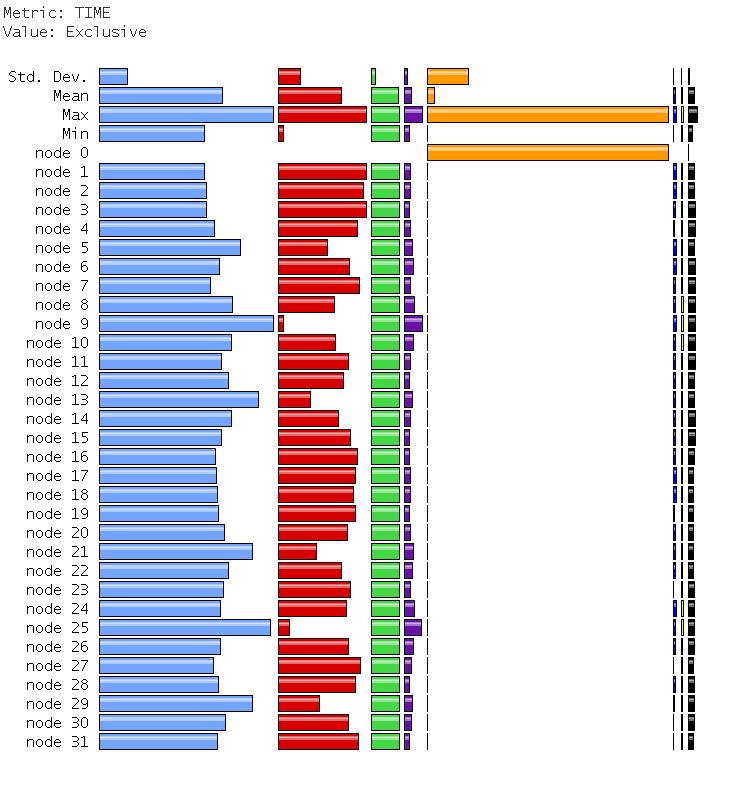
Profiles show good load balancing, but
a total domination of MPI_Win_unlock over
run time.
MPI_Barrier is in the second place, and
only cgca_hxi, the halo exchange routine,
exceeds the threshold of 1% of total time.
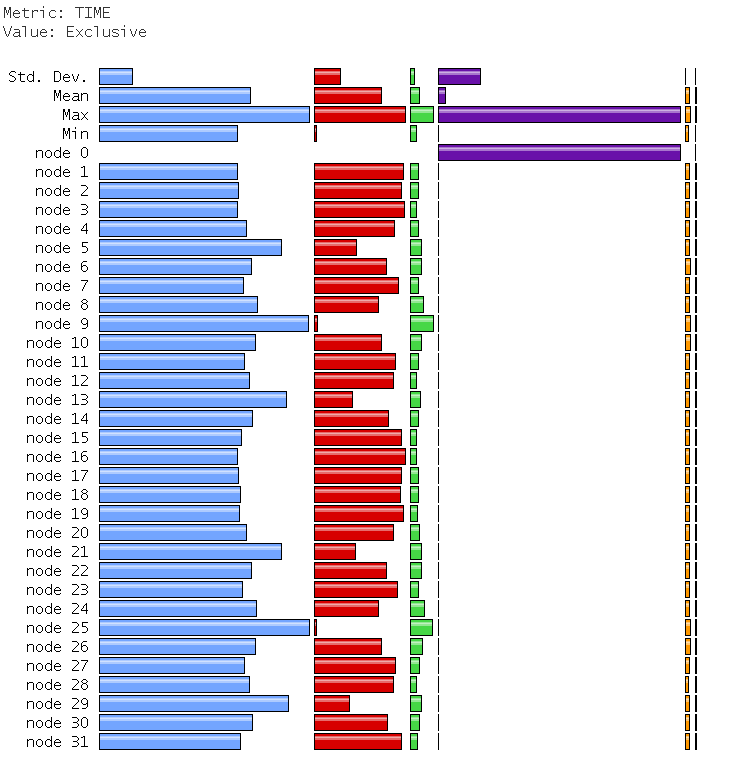
The orange bar on node 0 is caflaunch process,
which overwrites the profiling data from the program.
TAU (Sameer Shende) have sent me a patch to try to fix this.
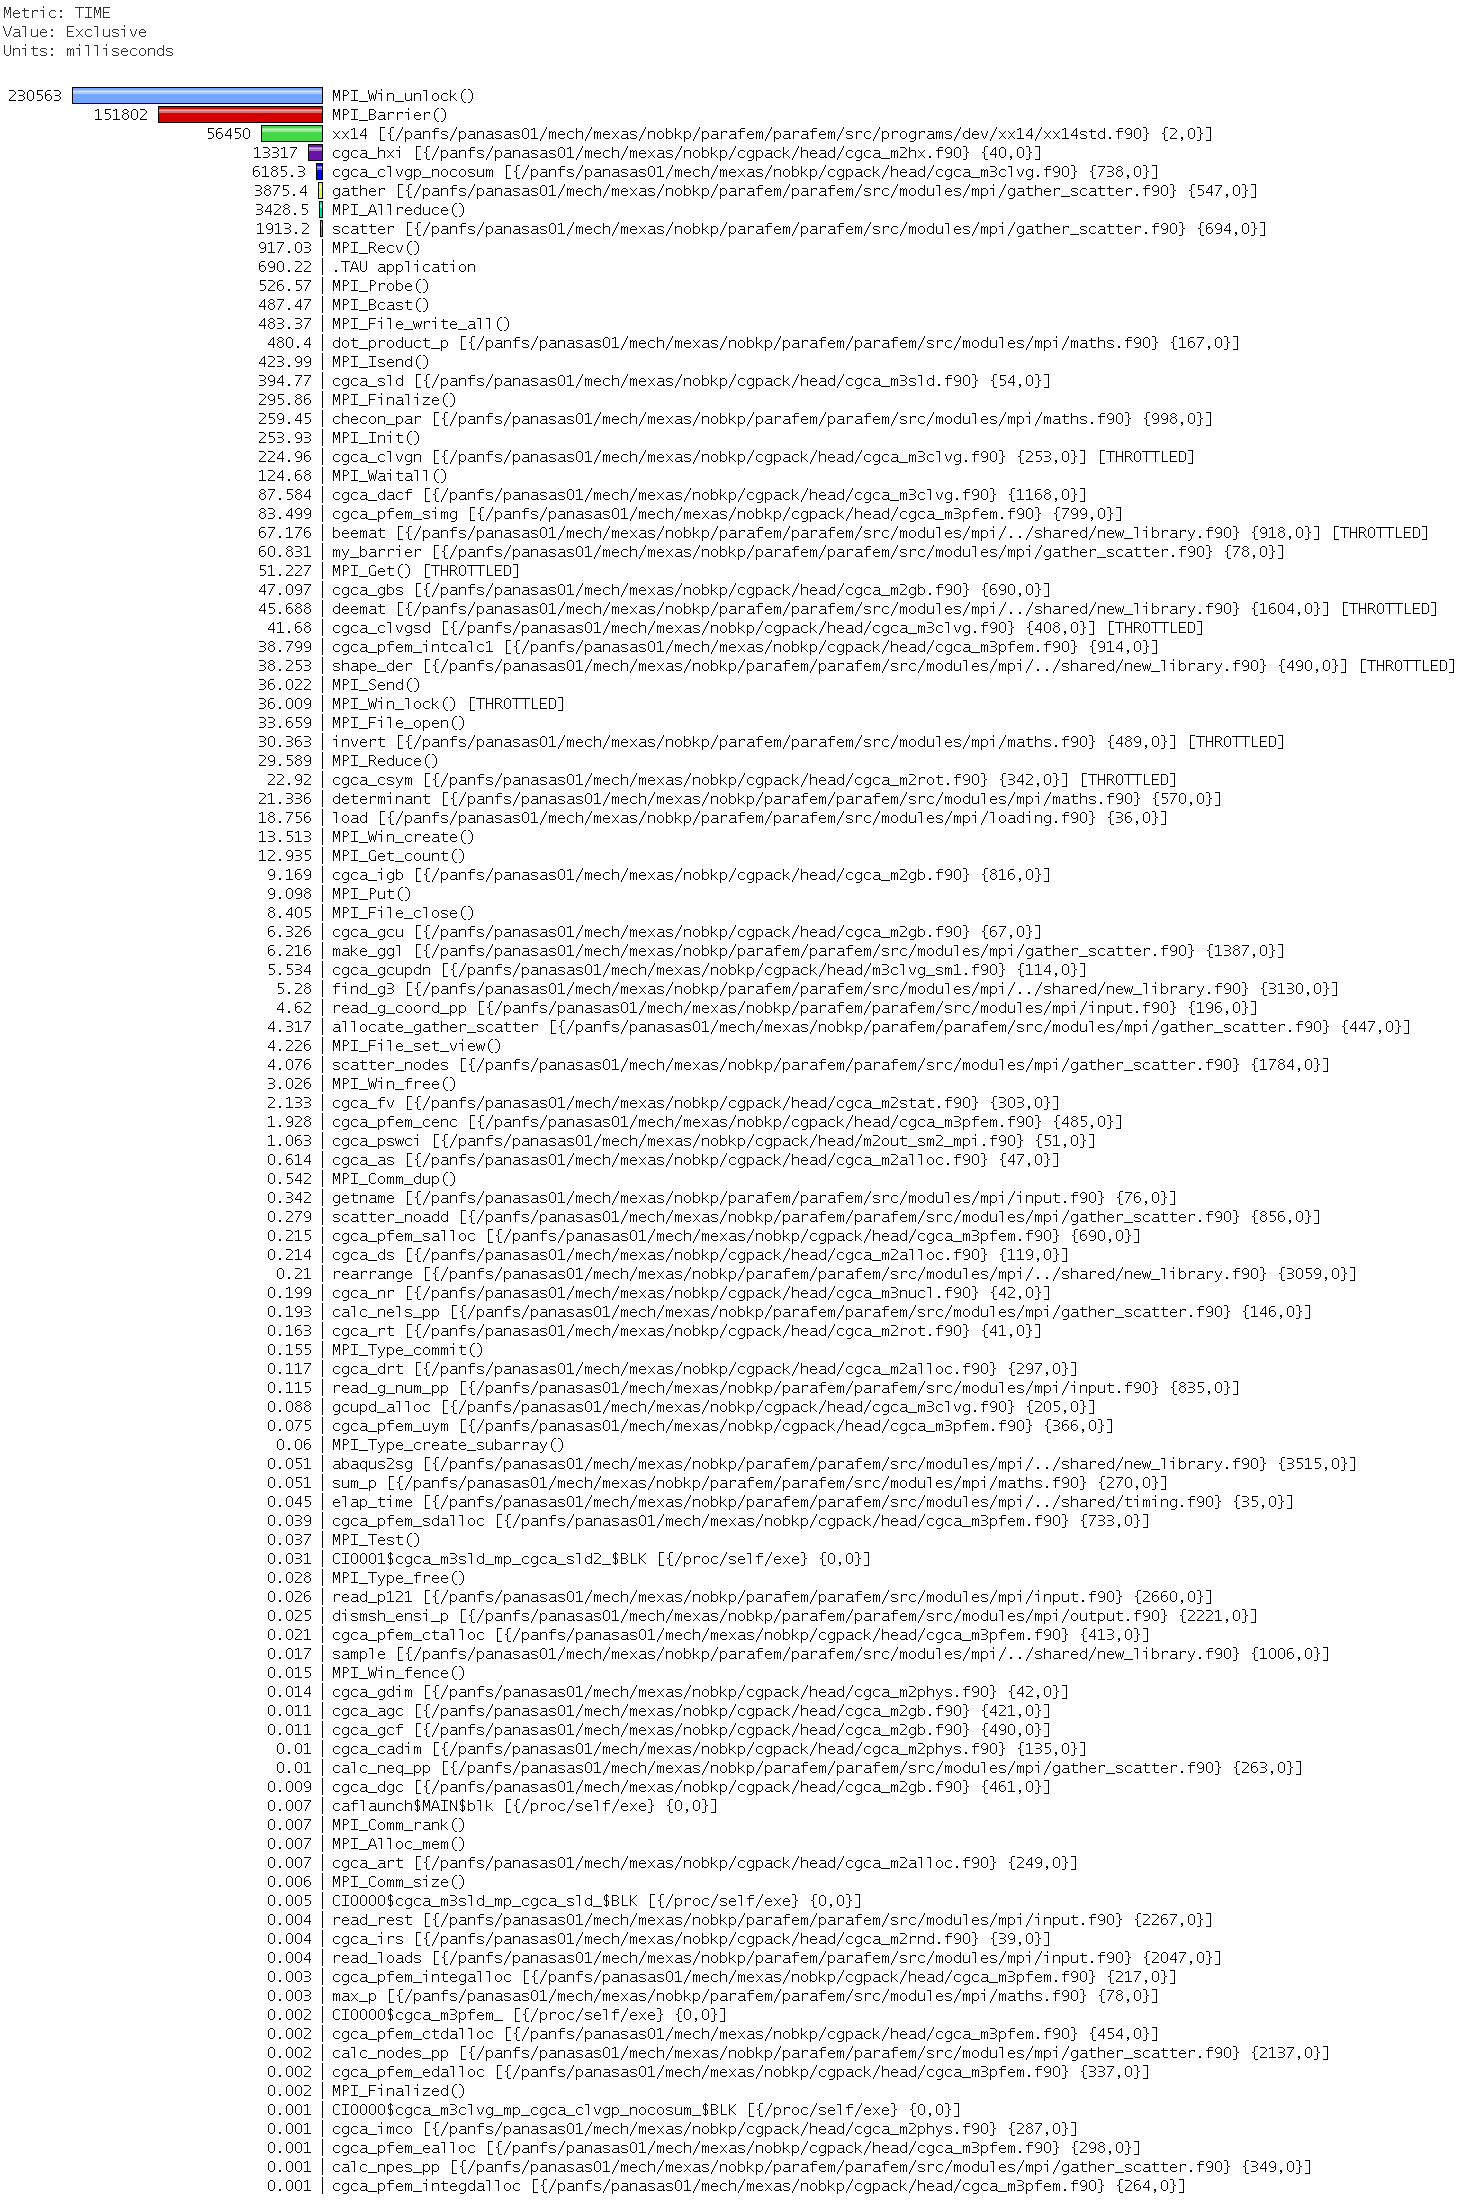
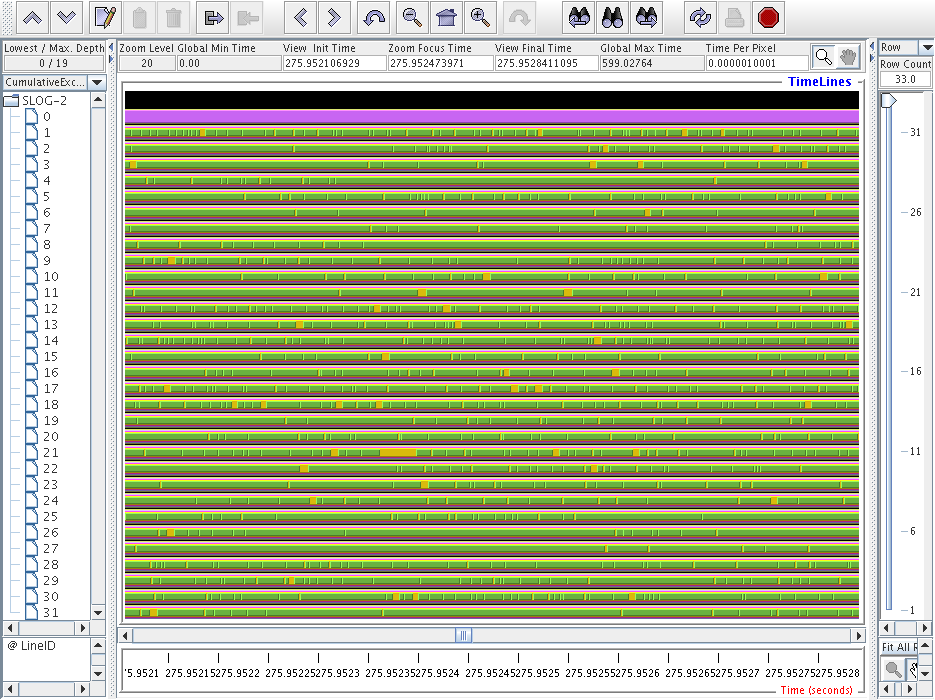
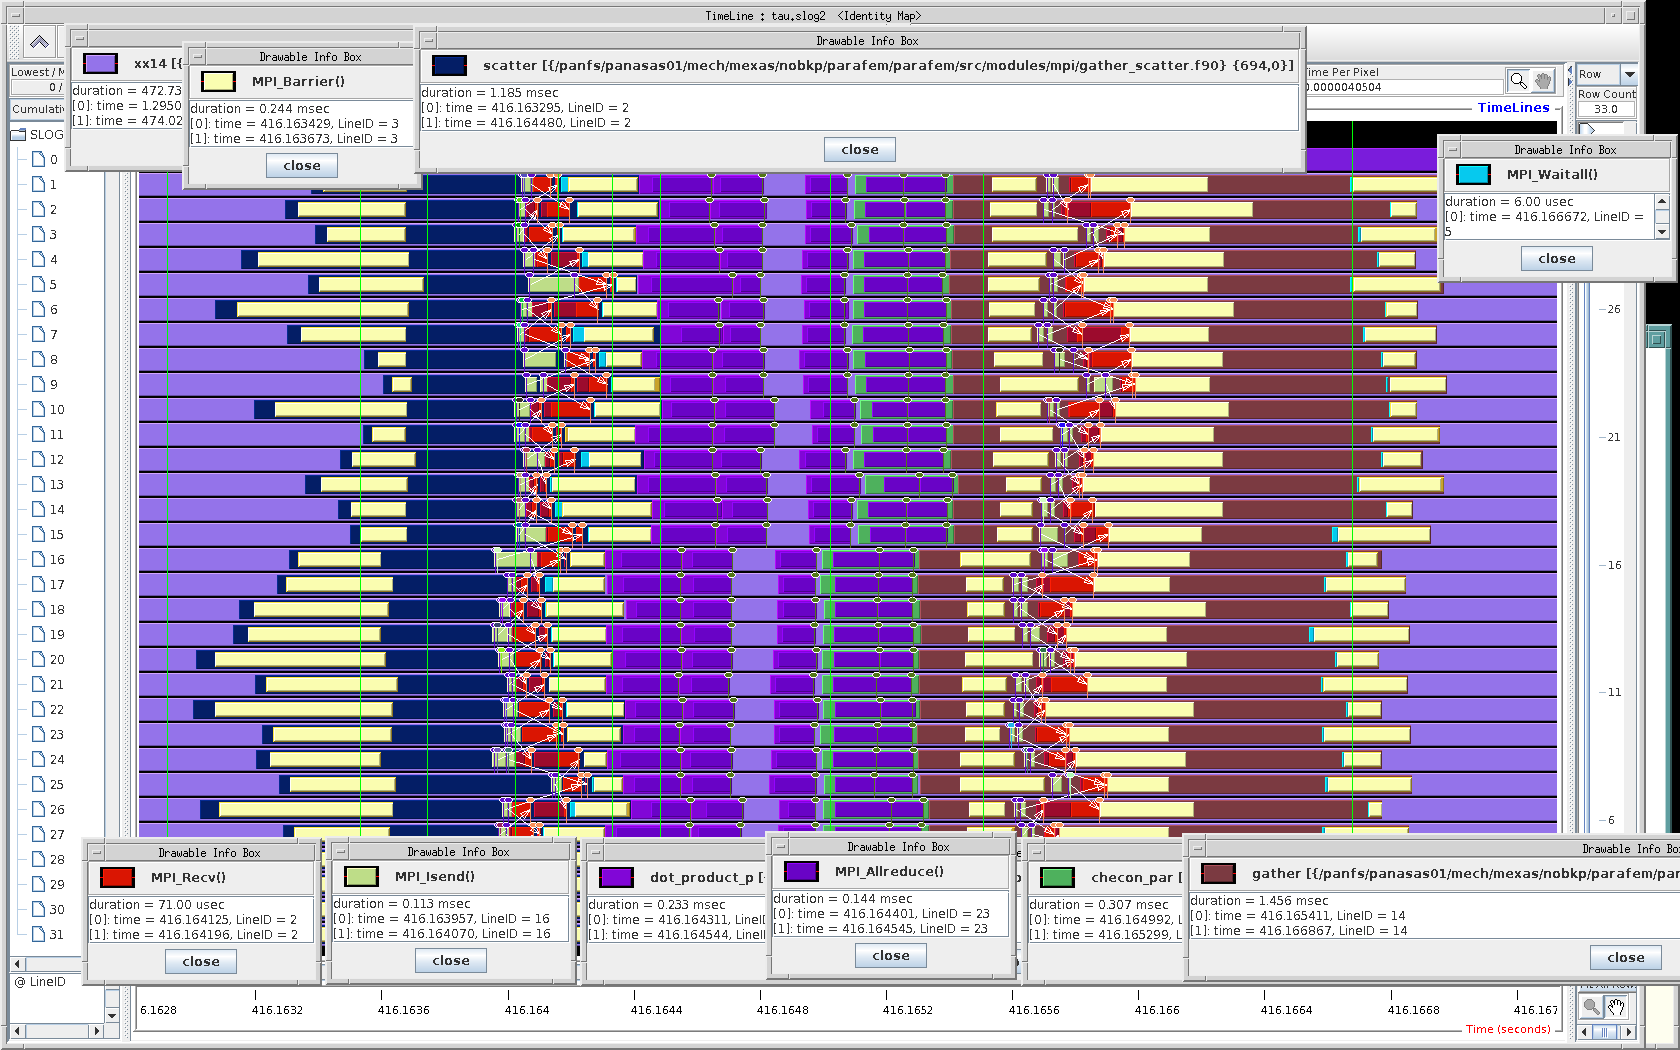
Finally, below are the jumpshot trace fragments. The ParaFEM part shows a nice pattern. These are the MPI calls which are already present in ParaFEM routines, nothing (hopefully) is added by the compiler.
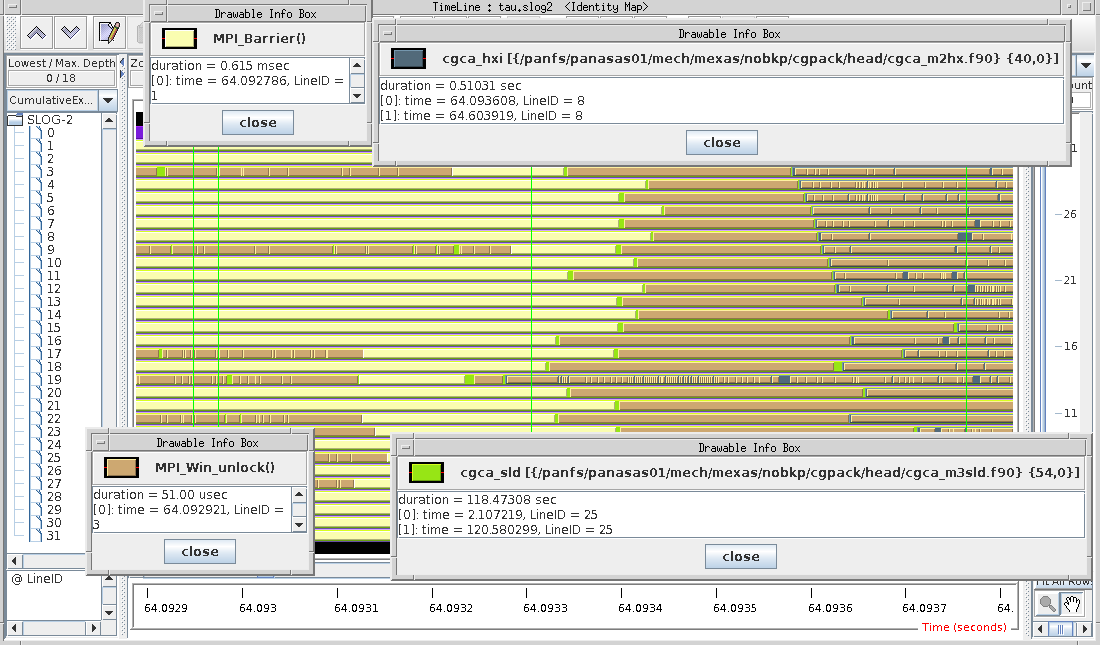
And here is the CGPACK part - what a mess!
Cannot see any pattern, and all images
are dominated by MPI_Win_unlock.
23-MAY-2016: Testing TAU fix to stop Intel's caflaunch
overwriting profile/trace data from node 0.
Sameer
posted
updated versions of
~/tau-2.25.1/src/Profile/Profiler.cpp
and
~/tau-2.25.1/src/Profile/Tracer.cpp.
I rebuilt/reinstalled TAU with these modified files.
There are 10 failures of validation tests, see
results3.html.
However, the MPI Fortran test is ok, so can proceed
to instrument my programs.
Re-testing CGPACK test
testABW.f90.
I rebuilt CGPACK library and tests with
export TAU_OPTIONS="-optShared -optVerbose -optCompInst"
It seems caflaunch has gone away:
Paraprof profile:
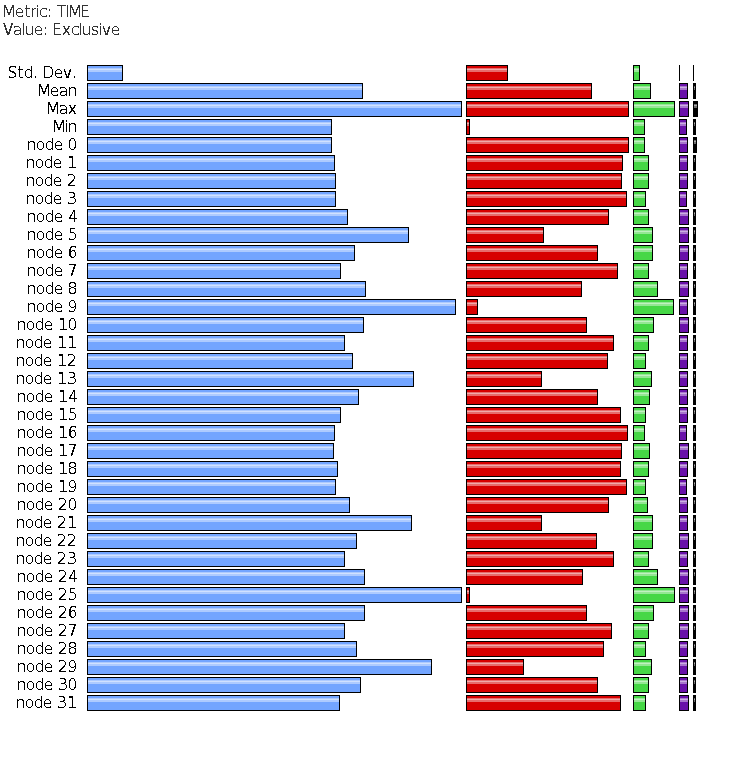
Jumpshot traces:
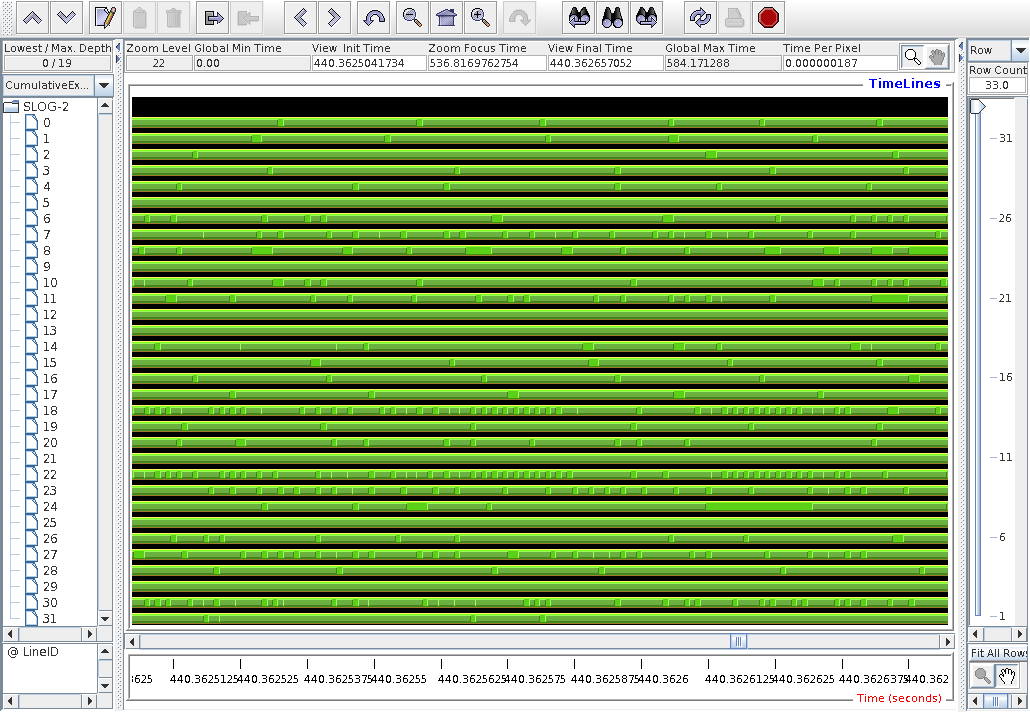
The same for CGPACK+ParaFEM
xx14std.f90 -
there is no more caflaunch process,
and the data from process 0 seems as expected.
Parafem profiles:
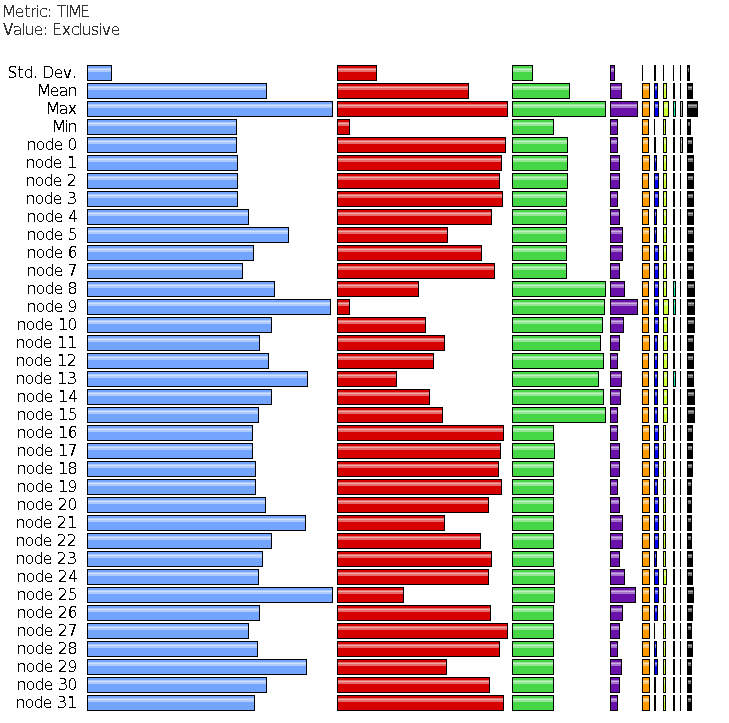
Jumpshot traces: (1) CGPACK part - MPI_Win_unlock:
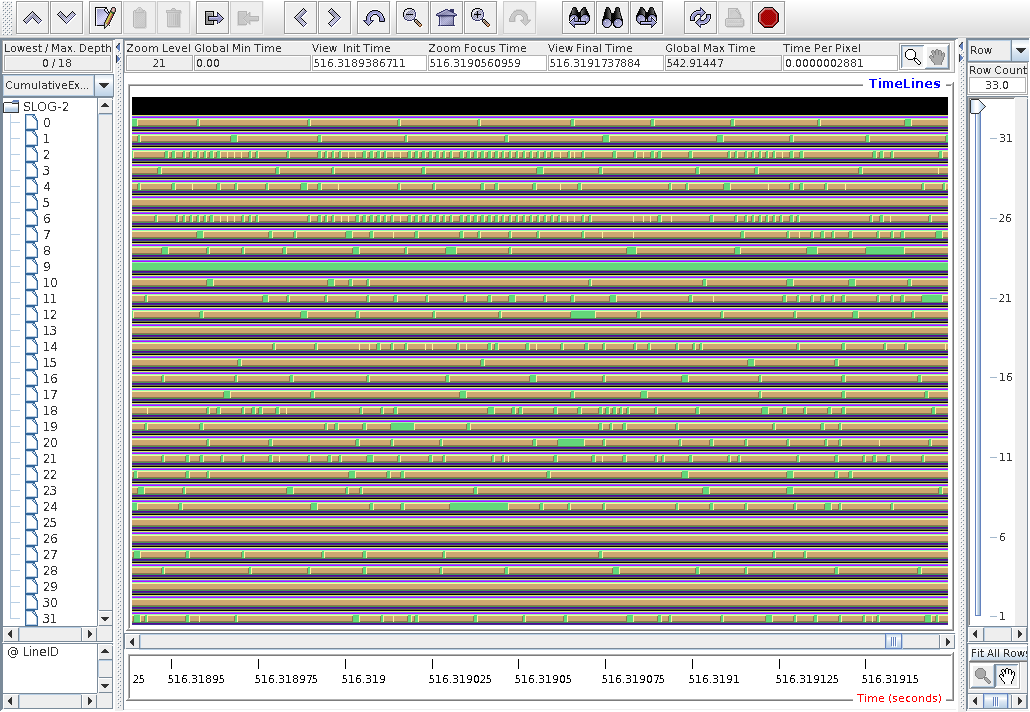
(2) ParaFEM part - structured comms pattern:
