CGPACK > APR-2016
12-APR-2016: Trying to build CGPACK on Hartree Centre BG/Q Blue Joule.
Managed to build GCC6 with.
Problems with Java, so excluded it.
Remember not to install prerequisites manually.
Just run contrib/download_prerequisites.
/gpfs/home/HCBG142/axs02/axs49-axs02/gcc-6-20160410/configure --prefix=$HOME/gcc6-install --enable-languages=c,c++,fortran,lto,objc
The built MPICH 3.2 and OpenCoarrays 1.4.0. No problems there.
[axs49-axs02@bglogin1 1img]$ which caf
~/OpenCoarrays-1.4.0/opencoarrays-installation/bin/caf
[axs49-axs02@bglogin1 1img]$ caf --version

OpenCoarrays Coarray Fortran Compiler Wrapper (caf version 1.4.0)
Copyright (C) 2015-2016 Sourcery, Inc.

OpenCoarrays comes with NO WARRANTY, to the extent permitted by law.
You may redistribute copies of OpenCoarrays under the terms of the
BSD 3-Clause License.  For more information about these matters, see
the file named LICENSE.

[axs49-axs02@bglogin1 1img]$ caf -w
caf wraps CAFC=mpif90
[axs49-axs02@bglogin1 1img]$ mpif90 --version
GNU Fortran (GCC) 6.0.0 20160410 (experimental)
Copyright (C) 2016 Free Software Foundation, Inc.
This is free software; see the source for copying conditions.  There is NO
warranty; not even for MERCHANTABILITY or FITNESS FOR A PARTICULAR PURPOSE.

[axs49-axs02@bglogin1 1img]$
18-APR-2016: Valgrind for coarrays?
On BlueCrystal phase 3, using examples from the
UoB coarrays course.
I used example
5pi.
In this example pi is calculated with coarrays, MPI, OpenMP and
Fortran
DO CONCURRENT.
The coarrays 5pi program is not conforming - it violates
the segment ordering rule.
The result, with
OpenCoarrays
and GCC6, is a race condition.
Valgrind memcheck.
The program is built with the following GCC flags:
OFLAGS= -Werror -O2 -g
Let's run it twice
newblue4> valgrind --tool=memcheck cafrun -np 8 pi_ca.ox
==29384== Memcheck, a memory error detector
==29384== Copyright (C) 2002-2012, and GNU GPL'd, by Julian Seward et al.
==29384== Using Valgrind-3.8.1 and LibVEX; rerun with -h for copyright info
==29384== Command: /panfs/panasas01/mech/mexas/OpenCoarrays-1.4.0/opencoarrays-installation/bin/cafrun -np 8 pi_ca.ox
==29384==
 coarrays:           8 images
 Series limit           2147483648
 Calculated  pi=   2.8917362726850495
 Reference   pi=   3.1415926535897931
 Absolute error= -0.24985638090474360
==29384==
==29384== HEAP SUMMARY:
==29384==     in use at exit: 37,579 bytes in 862 blocks
==29384==   total heap usage: 1,687 allocs, 825 frees, 69,820 bytes allocated
==29384==
==29384== LEAK SUMMARY:
==29384==    definitely lost: 0 bytes in 0 blocks
==29384==    indirectly lost: 0 bytes in 0 blocks
==29384==      possibly lost: 0 bytes in 0 blocks
==29384==    still reachable: 37,579 bytes in 862 blocks
==29384==         suppressed: 0 bytes in 0 blocks
==29384== Rerun with --leak-check=full to see details of leaked memory
==29384==
==29384== For counts of detected and suppressed errors, rerun with: -v
==29384== ERROR SUMMARY: 0 errors from 0 contexts (suppressed: 6 from 6)
newblue4>
newblue4> valgrind --tool=memcheck cafrun -np 8 pi_ca.ox
==30710== Memcheck, a memory error detector
==30710== Copyright (C) 2002-2012, and GNU GPL'd, by Julian Seward et al.
==30710== Using Valgrind-3.8.1 and LibVEX; rerun with -h for copyright info
==30710== Command: /panfs/panasas01/mech/mexas/OpenCoarrays-1.4.0/opencoarrays-installation/bin/cafrun -np 8 pi_ca.ox
==30710==
 coarrays:           8 images
 Series limit           2147483648
 Calculated  pi=   8.9717436360251348
 Reference   pi=   3.1415926535897931
 Absolute error=   5.8301509824353417
==30710==
==30710== HEAP SUMMARY:
==30710==     in use at exit: 37,579 bytes in 862 blocks
==30710==   total heap usage: 1,687 allocs, 825 frees, 69,820 bytes allocated
==30710==
==30710== LEAK SUMMARY:
==30710==    definitely lost: 0 bytes in 0 blocks
==30710==    indirectly lost: 0 bytes in 0 blocks
==30710==      possibly lost: 0 bytes in 0 blocks
==30710==    still reachable: 37,579 bytes in 862 blocks
==30710==         suppressed: 0 bytes in 0 blocks
==30710== Rerun with --leak-check=full to see details of leaked memory
==30710==
==30710== For counts of detected and suppressed errors, rerun with: -v
==30710== ERROR SUMMARY: 0 errors from 0 contexts (suppressed: 6 from 6)
newblue4>
I use top to make sure 8 MPI processes
were run:
newblue4> top -u $USER -d 1 -b
top - 13:54:00 up 339 days,  2:51, 50 users,  load average: 1.20, 1.30, 1.46
Tasks: 826 total,   9 running, 808 sleeping,   9 stopped,   0 zombie
Cpu(s):  7.0%us,  1.9%sy,  0.2%ni, 90.2%id,  0.5%wa,  0.0%hi,  0.2%si,  0.0%st
Mem:  132250920k total, 113290340k used, 18960580k free,    85860k buffers
Swap: 11999224k total, 11999224k used,        0k free, 99640332k cached

  PID USER      PR  NI  VIRT  RES  SHR S %CPU %MEM    TIME+  COMMAND
30720 mexas     20   0 72384 6796 2312 R 94.5  0.0   0:01.23 pi_ca.ox
30714 mexas     20   0 72952 7316 2336 R 92.7  0.0   0:01.22 pi_ca.ox
30715 mexas     20   0 72384 6788 2304 R 92.7  0.0   0:01.23 pi_ca.ox
30716 mexas     20   0 72384 6800 2316 R 92.7  0.0   0:01.23 pi_ca.ox
30717 mexas     20   0 72384 6792 2308 R 92.7  0.0   0:01.23 pi_ca.ox
30718 mexas     20   0 72384 6796 2312 R 92.7  0.0   0:01.23 pi_ca.ox
30719 mexas     20   0 72384 6788 2304 R 92.7  0.0   0:01.23 pi_ca.ox
30721 mexas     20   0 72384 6788 2304 R 92.7  0.0   0:01.23 pi_ca.ox
30722 mexas     20   0 17644 1812  896 R  1.8  0.0   0:00.02 top
21325 mexas     20   0  111m 2104 1036 S  0.0  0.0   0:00.10 sshd
21327 mexas     20   0  112m 2000 1292 S  0.0  0.0   0:00.12 tcsh
30710 mexas     20   0  215m  48m 2272 S  0.0  0.0   0:00.62 memcheck-amd64-
30712 mexas     20   0 19888 1300 1052 S  0.0  0.0   0:00.00 mpirun
30713 mexas     20   0 19940 2224  988 S  0.0  0.0   0:00.00 hydra_pmi_proxy
31820 mexas     20   0  111m 2112 1036 S  0.0  0.0   0:00.10 sshd
31821 mexas     20   0  112m 1952 1288 S  0.0  0.0   0:00.04 tcsh
In the last example the valgrind process
(memcheck-amd64-) is 30710.
The pi_ca.ox processes are 30714-30721.
So I'm not completely sure valgrind analysed
pi_ca.ox processes?
Valgrind cachegrind
Using GCC fast optimisation:
OFLAGS= -Werror -Ofast -g
newblue4> valgrind --tool=cachegrind cafrun -np 8 pi_ca.ox
==1727== Cachegrind, a cache and branch-prediction profiler
==1727== Copyright (C) 2002-2012, and GNU GPL'd, by Nicholas Nethercote et al.
==1727== Using Valgrind-3.8.1 and LibVEX; rerun with -h for copyright info
==1727== Command: /panfs/panasas01/mech/mexas/OpenCoarrays-1.4.0/opencoarrays-installation/bin/cafrun -np 8 pi_ca.ox
==1727==
--1727-- warning: L3 cache found, using its data for the LL simulation.
 coarrays:           8 images
 Series limit           2147483648
 Calculated  pi=   2.7101303765544751
 Reference   pi=   3.1415926535897931
 Absolute error= -0.43146227703531803
==1727==
==1727== I   refs:      4,208,893
==1727== I1  misses:        4,349
==1727== LLi misses:        2,910
==1727== I1  miss rate:      0.10%
==1727== LLi miss rate:      0.06%
==1727==
==1727== D   refs:      1,923,847  (1,184,360 rd   + 739,487 wr)
==1727== D1  misses:        7,487  (    5,611 rd   +   1,876 wr)
==1727== LLd misses:        4,664  (    3,019 rd   +   1,645 wr)
==1727== D1  miss rate:       0.3% (      0.4%     +     0.2%  )
==1727== LLd miss rate:       0.2% (      0.2%     +     0.2%  )
==1727==
==1727== LL refs:          11,836  (    9,960 rd   +   1,876 wr)
==1727== LL misses:         7,574  (    5,929 rd   +   1,645 wr)
==1727== LL miss rate:        0.1% (      0.1%     +     0.2%  )
newblue4>
Or switching optimisation off completely:
OFLAGS= -Werror -O0 -g
newblue4> valgrind --tool=cachegrind cafrun -np 8 pi_ca.ox
==2202== Cachegrind, a cache and branch-prediction profiler
==2202== Copyright (C) 2002-2012, and GNU GPL'd, by Nicholas Nethercote et al.
==2202== Using Valgrind-3.8.1 and LibVEX; rerun with -h for copyright info
==2202== Command: /panfs/panasas01/mech/mexas/OpenCoarrays-1.4.0/opencoarrays-installation/bin/cafrun -np 8 pi_ca.ox
==2202==
--2202-- warning: L3 cache found, using its data for the LL simulation.
 coarrays:           8 images
 Series limit           2147483648
 Calculated  pi=   3.1341261683818322
 Reference   pi=   3.1415926535897931
 Absolute error=  -7.4664852079608934E-003
==2202==
==2202== I   refs:      4,208,893
==2202== I1  misses:        4,349
==2202== LLi misses:        2,910
==2202== I1  miss rate:      0.10%
==2202== LLi miss rate:      0.06%
==2202==
==2202== D   refs:      1,923,847  (1,184,360 rd   + 739,487 wr)
==2202== D1  misses:        7,487  (    5,611 rd   +   1,876 wr)
==2202== LLd misses:        4,664  (    3,019 rd   +   1,645 wr)
==2202== D1  miss rate:       0.3% (      0.4%     +     0.2%  )
==2202== LLd miss rate:       0.2% (      0.2%     +     0.2%  )
==2202==
==2202== LL refs:          11,836  (    9,960 rd   +   1,876 wr)
==2202== LL misses:         7,574  (    5,929 rd   +   1,645 wr)
==2202== LL miss rate:        0.1% (      0.1%     +     0.2%  )
newblue4>
or with 4 processors:
newblue4> valgrind --tool=cachegrind cafrun -np 4 pi_ca.ox
==4883== Cachegrind, a cache and branch-prediction profiler
==4883== Copyright (C) 2002-2012, and GNU GPL'd, by Nicholas Nethercote et al.
==4883== Using Valgrind-3.8.1 and LibVEX; rerun with -h for copyright info
==4883== Command: /panfs/panasas01/mech/mexas/OpenCoarrays-1.4.0/opencoarrays-installation/bin/cafrun -np 4 pi_ca.ox
==4883==
--4883-- warning: L3 cache found, using its data for the LL simulation.
 coarrays:           4 images
 Series limit           2147483648
 Calculated  pi=   3.1424731464854290
 Reference   pi=   3.1415926535897931
 Absolute error=   8.8049289563585376E-004
==4883==
==4883== I   refs:      4,208,893
==4883== I1  misses:        4,349
==4883== LLi misses:        2,910
==4883== I1  miss rate:      0.10%
==4883== LLi miss rate:      0.06%
==4883==
==4883== D   refs:      1,923,847  (1,184,360 rd   + 739,487 wr)
==4883== D1  misses:        7,487  (    5,611 rd   +   1,876 wr)
==4883== LLd misses:        4,664  (    3,019 rd   +   1,645 wr)
==4883== D1  miss rate:       0.3% (      0.4%     +     0.2%  )
==4883== LLd miss rate:       0.2% (      0.2%     +     0.2%  )
==4883==
==4883== LL refs:          11,836  (    9,960 rd   +   1,876 wr)
==4883== LL misses:         7,574  (    5,929 rd   +   1,645 wr)
==4883== LL miss rate:        0.1% (      0.1%     +     0.2%  )
newblue4>
No difference.
I suspect Valgrind data is not being collected from
my coarray executable, but from cafrun?
After running cg_annotate:
newblue4> cg_annotate cachegrind.out.4883
--------------------------------------------------------------------------------
I1 cache:         32768 B, 64 B, 8-way associative
D1 cache:         32768 B, 64 B, 8-way associative
LL cache:         20971520 B, 64 B, 20-way associative
Command:          /panfs/panasas01/mech/mexas/OpenCoarrays-1.4.0/opencoarrays-installation/bin/cafrun -np 4 pi_ca.ox
Data file:        cachegrind.out.4883
Events recorded:  Ir I1mr ILmr Dr D1mr DLmr Dw D1mw DLmw
Events shown:     Ir I1mr ILmr Dr D1mr DLmr Dw D1mw DLmw
Event sort order: Ir I1mr ILmr Dr D1mr DLmr Dw D1mw DLmw
Thresholds:       0.1 100 100 100 100 100 100 100 100
Include dirs:
User annotated:
Auto-annotation:  off

--------------------------------------------------------------------------------
       Ir  I1mr  ILmr        Dr  D1mr  DLmr      Dw  D1mw  DLmw
--------------------------------------------------------------------------------
4,208,893 4,349 2,910 1,184,360 5,611 3,019 739,487 1,876 1,645  PROGRAM TOTALS

--------------------------------------------------------------------------------
       Ir  I1mr ILmr      Dr  D1mr DLmr      Dw D1mw DLmw  file:function
--------------------------------------------------------------------------------
1,349,101    39   16 468,685     0    0 300,450   13    3  ???:__gconv_transform_utf8_internal
  933,990    16    7 227,649     5    0 227,649    1    1  ???:mbrtowc
  666,588 1,083  684 162,049   487  161  74,010  159  141  ???:???
  220,250   105   46  31,595    31    1  30,640  728  692  ???:_int_malloc
  130,057    15    4  12,408     0    0  12,124    0    0  ???:mbschr
   75,696    66   15  25,102   695  229  11,617   19    4  ???:do_lookup_x
   66,080     5    3  34,778    62   53   6,959    1    0  ???:buffered_getchar
   59,451    12   12  13,363 1,003  820      17    1    0  ???:_dl_addr
   58,914     7    6  20,166     5    0   6,723    1    1  ???:malloc
   55,483    80   19  14,538    26    0   6,431    3    0  ???:_int_free
   53,564     2    1  40,173     1    0       0    0    0  ???:_dl_mcount_wrapper_check
   46,519    78   45  11,555   124   77   6,191   14    8  ???:yyparse
   40,303    20   11   8,657   198  140   4,923   16    3  ???:_dl_lookup_symbol_x
   33,027    13    2  10,362   161   73       0    0    0  ???:strcmp
   27,656     7    4   4,933   150   43       0    0    0  ???:__strlen_sse42
   27,442     2    2   6,457     1    1   4,844    0    0  ???:xmalloc
   27,236    39   39   7,463   914  825   2,823  271  255  ???:_dl_relocate_object
   25,679    20   11   8,553    40    2     732    0    0  ???:getenv
   18,118    18   12   5,167     0    0   3,589   21    3  ???:msort_with_tmp
   14,400     8    5   3,099    87   18     995    2    0  ???:hash_search
   11,965    66   32   2,416    10    2       0    0    0  ???:__strcmp_sse42
   11,874    10    3   2,394    22    0       0    0    0  ???:free
   11,743    32   12   1,910     2    1   1,523   14   13  ???:memcpy
   11,052    13    6   4,523   206   51   1,388   22    1  ???:check_match.12439
    9,850     7    2   2,754    26    0   1,578    3    1  ???:_dl_name_match_p
    7,524    26   18   1,606    33   16       0    0    0  ???:__GI_strcmp
    7,439     9    4   1,396     2    0     859    0    0  ???:hash_insert
    6,300    28    9   1,518     8    0   1,189   33   31  ???:malloc_consolidate
    6,057    13    3   1,106    76    0     436    0    0  ???:builtin_address_internal
    5,537    21    7   2,135   228   54     767    0    0  ???:_dl_fixup
    5,373     6    6   2,026    65   63     466   42   42  ???:_nl_intern_locale_data
    5,023    32   32     677    20    4     472    3    3  ???:initialize_shell_variables
    4,856     6    3     596     1    0       0    0    0  ???:__strchr_sse42
    4,710     4    1   4,710     6    0       0    0    0  ???:__ctype_get_mb_cur_max
    4,657    18    4   1,067     5    0     396    0    0  ???:assignment

newblue4>
Again, there are no calls to commands in pi_ca.f90,
so I assume valgrind is not really checking my program.
Perhaps I need to follow valgrind
MPI instructions,
but they say
"Currently the wrappers are only buildable with
mpiccs which are based on GNU GCC or Intel's C++ Compiler."
So looks like Fortran MPI is not supported by valgrind.
20-APR-2016: Back to building CGPACK on BG/Q
I missed this page on:
cross-compiling.
What I built before was only for the login
nodes, where cafrun does indeed work.
Trying to submit to batch queue gives:
2016-04-20 12:20:32.779 (FATAL) [0x400012f9110] :4210:ibm.runjob.client.Job: could not start job: job failed to start
2016-04-20 12:20:32.780 (FATAL) [0x400012f9110] :4210:ibm.runjob.client.Job: Load failed on Q03-I0-J03: Application executable ELF header contains invalid value, errno 8 Exec format error
because the executable is not built for the computing nodes.
21-APR-2016: Back to Jumpshot again
Jumpshot-4 User Guide in HTML or PDF. More on ANL viewers.
Finally managed to run a coarray program with TAU. Seems one needs to add
call TAU_PROFILE_SET_NODE( this_image() )
to the program, so that TAU sets the ID of each image correctly. Here is the ref page for this subroutine. This is the advice from TAU devs, via ptools-perfapi mailing list.
I use pi calculation example, 5pi, from the UoB coarrays course, where pi is calculated via Leibnitz-Gregory series.
I start with running this shell script under 5pi:
#!/bin/sh

export TAU_OPTIONS="-optVerbose -optCompInst"
export TAU_MAKEFILE=$HOME/tau-2.25/x86_64/lib/Makefile.tau-icpc-papi-mpi-pdt-profile-trace

make clean -i
make all -i
and I use this
Makefile
I also use this tau.conf:
TAU_COMM_MATRIX=1
TAU_METRICS=PAPI_BR_CN,PAPI_BR_TKN,PAPI_BR_NTK,PAPI_BR_MSP,PAPI_BR_PRC
TAU_TRACE=1
TAU_PROFILE=1
TAU_CALLPATH=1
TAU_CALLPATH_DEPTH=100
I can then submit the job into the batch queue. No changes are needed for the PBS job script to use TAU.
When using a single BlueCrystal phase 3 node,
16 cores, I get from pprof these
results.
Several
paraprof screenshots are shown below from a run on 16 cores.
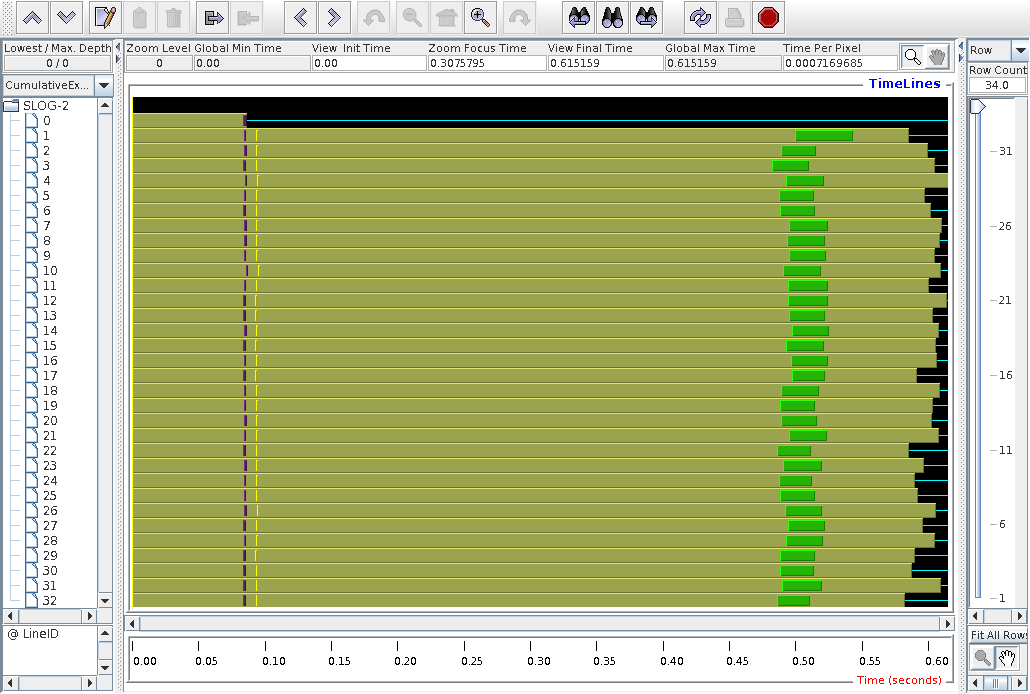
Note that there is "node 0", in addition to the 16 images (nodes) used to run the program. Node 0 is special. Apparently this is some additional MPI? process (this was built with ifort 16, which implements coarrays over MPI) launched to supervise the 16 worker images (nodes). This is what I think at this stage. The colours are explained in the two node plots below.
node 13:
node 0:
The actual calculation, the pica program, is extremely well balanced between the images, as expected:
22-APR-2016: Jumpshot on 2 nodes
Continuing from yesterday, running on 2 nodes in testq.
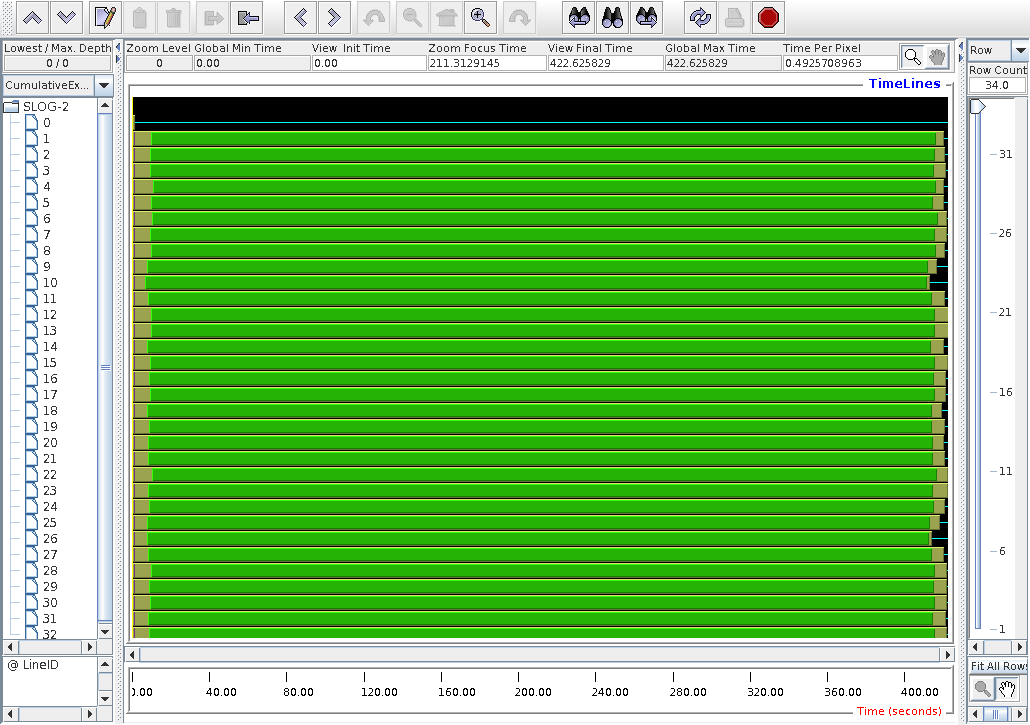
Following is the Jumpshot-4 trace.
It's interesting that caflaunch process
now takes very little time on node 0.
I suspect that Intel runtime is different on a single
and multiple nodes.

paraprof shows additional interesting results,
in this case hardware counter PAPI_L1_DCM - level 1 data
cache misses.
The actual setting in tau.conf was
TAU_METRICS=PAPI_L1_DCM,PAPI_L1_ICM,PAPI_L2_DCM,PAPI_L2_ICM,PAPI_L3_DCM,PAPI_L3_ICM
There is a long list of possible
TAU_METRICS.
To check what is available on your system, do
papi_avail.
There are a lot of hits for the .TAU application, and there is a visible difference between the first 16 "nodes", which are probably on one physical node, and the other 16 "nodes", which are probably on the other physical node.
I have no idea whether 10^4 L1 data cache misses is a lot or not. Need to compare with something.
26-APR-2016: Jumpshot for Laplace equation solver
Trying to use jumpshot for the Laplacian equation
solver program.
I use
9laplace
program (actually several different programs) from
the
UoB coarrays
course.
In this program an image is read from file into a 2D array.
This image is the edges of the original, reference, image.
The 2D array is split into chunks and distributed to images.
Then there is a loop for integration of the Lapacian
equation.
Each loop there is a halo exchange and multiple
SYNC ALL.
Although the instrumented program runs to completion,
there are absolutely no communications shown in jumpshot.
In the example below I use
co_back2.f90
program, which splits the image into a 2D array of
chunks.
Accordingly coarrays with 2 codimensions are used:
integer, allocatable :: localedge(:,:), globaledge(:,:)[:,:],          &
  edge(:,:)[:,:]
real, allocatable :: pic(:,:)[:,:], oldpic(:,:)[:,:]
If the program coback2 and the
.TAU routines are removed from view,
there is not much else left:
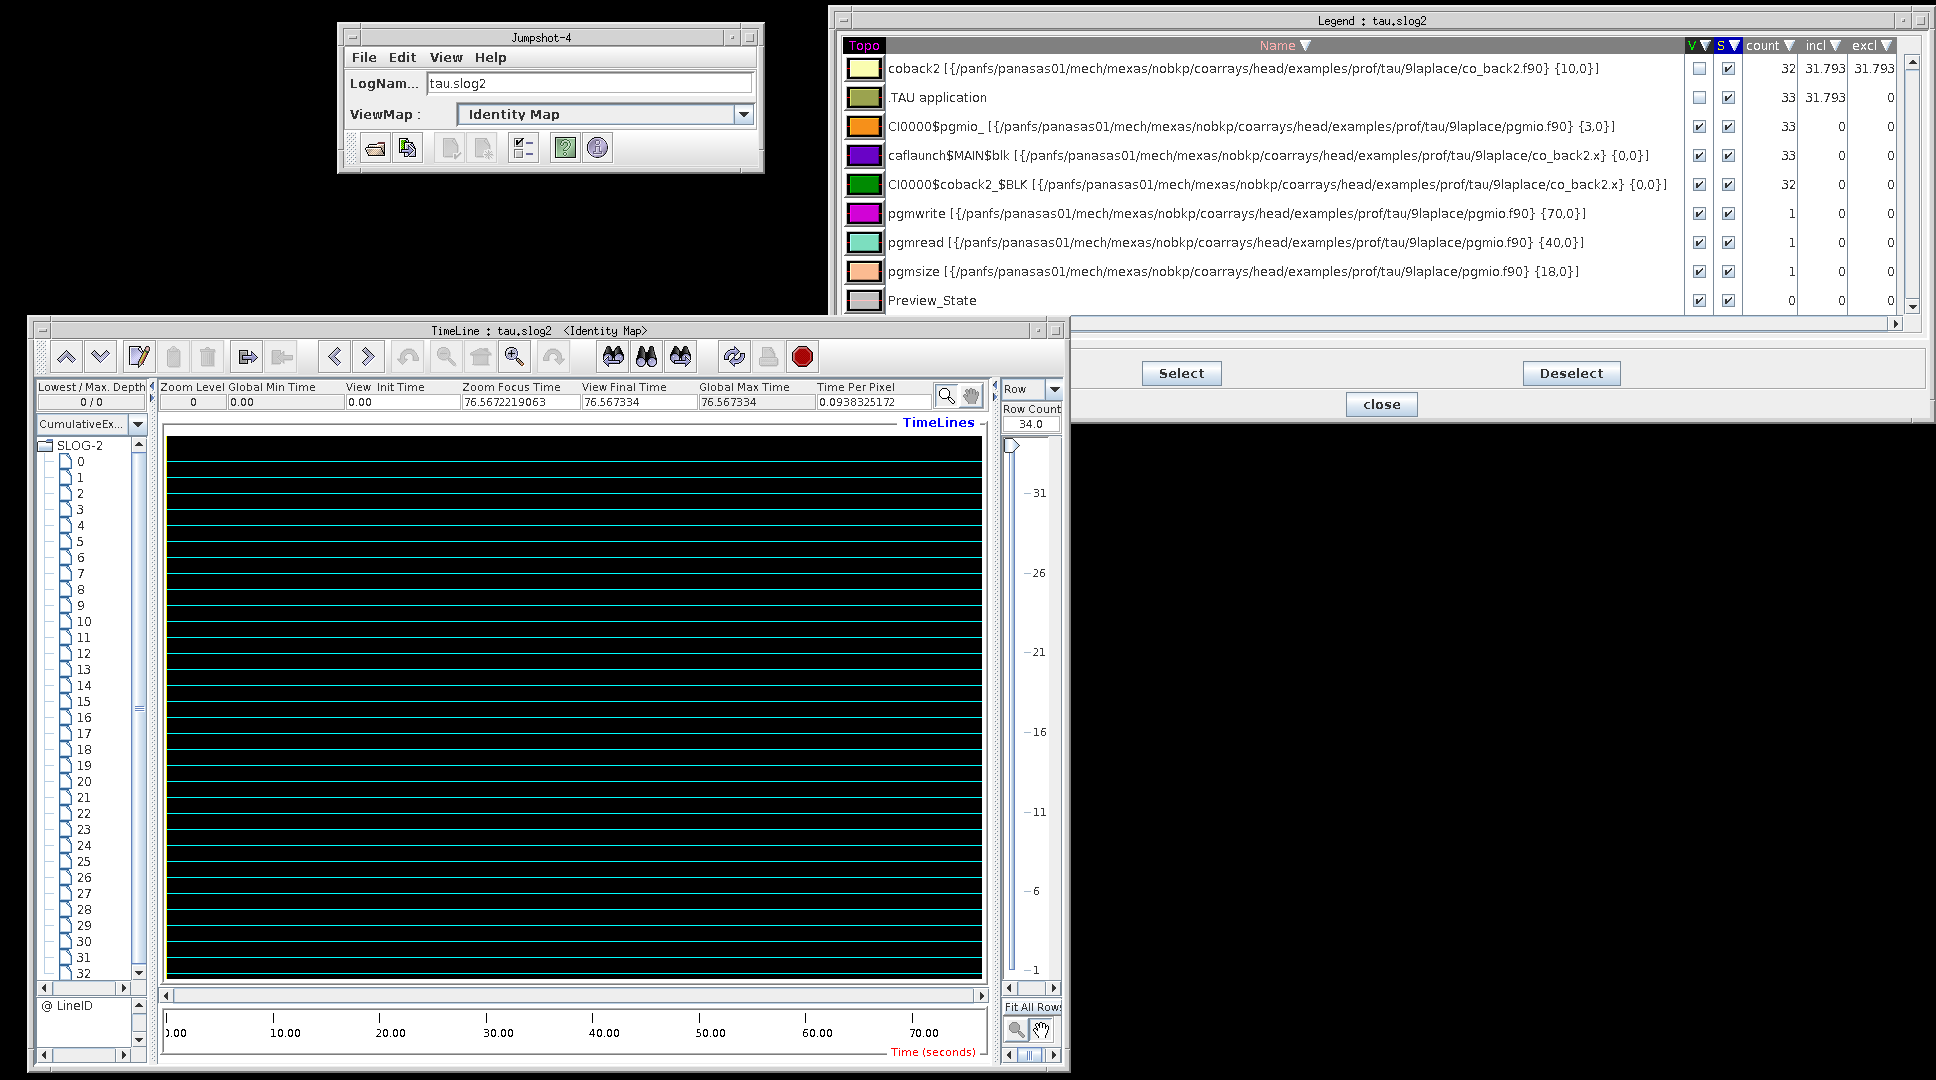
Here the very beginning of the trace is shown, with various routines highlighted.
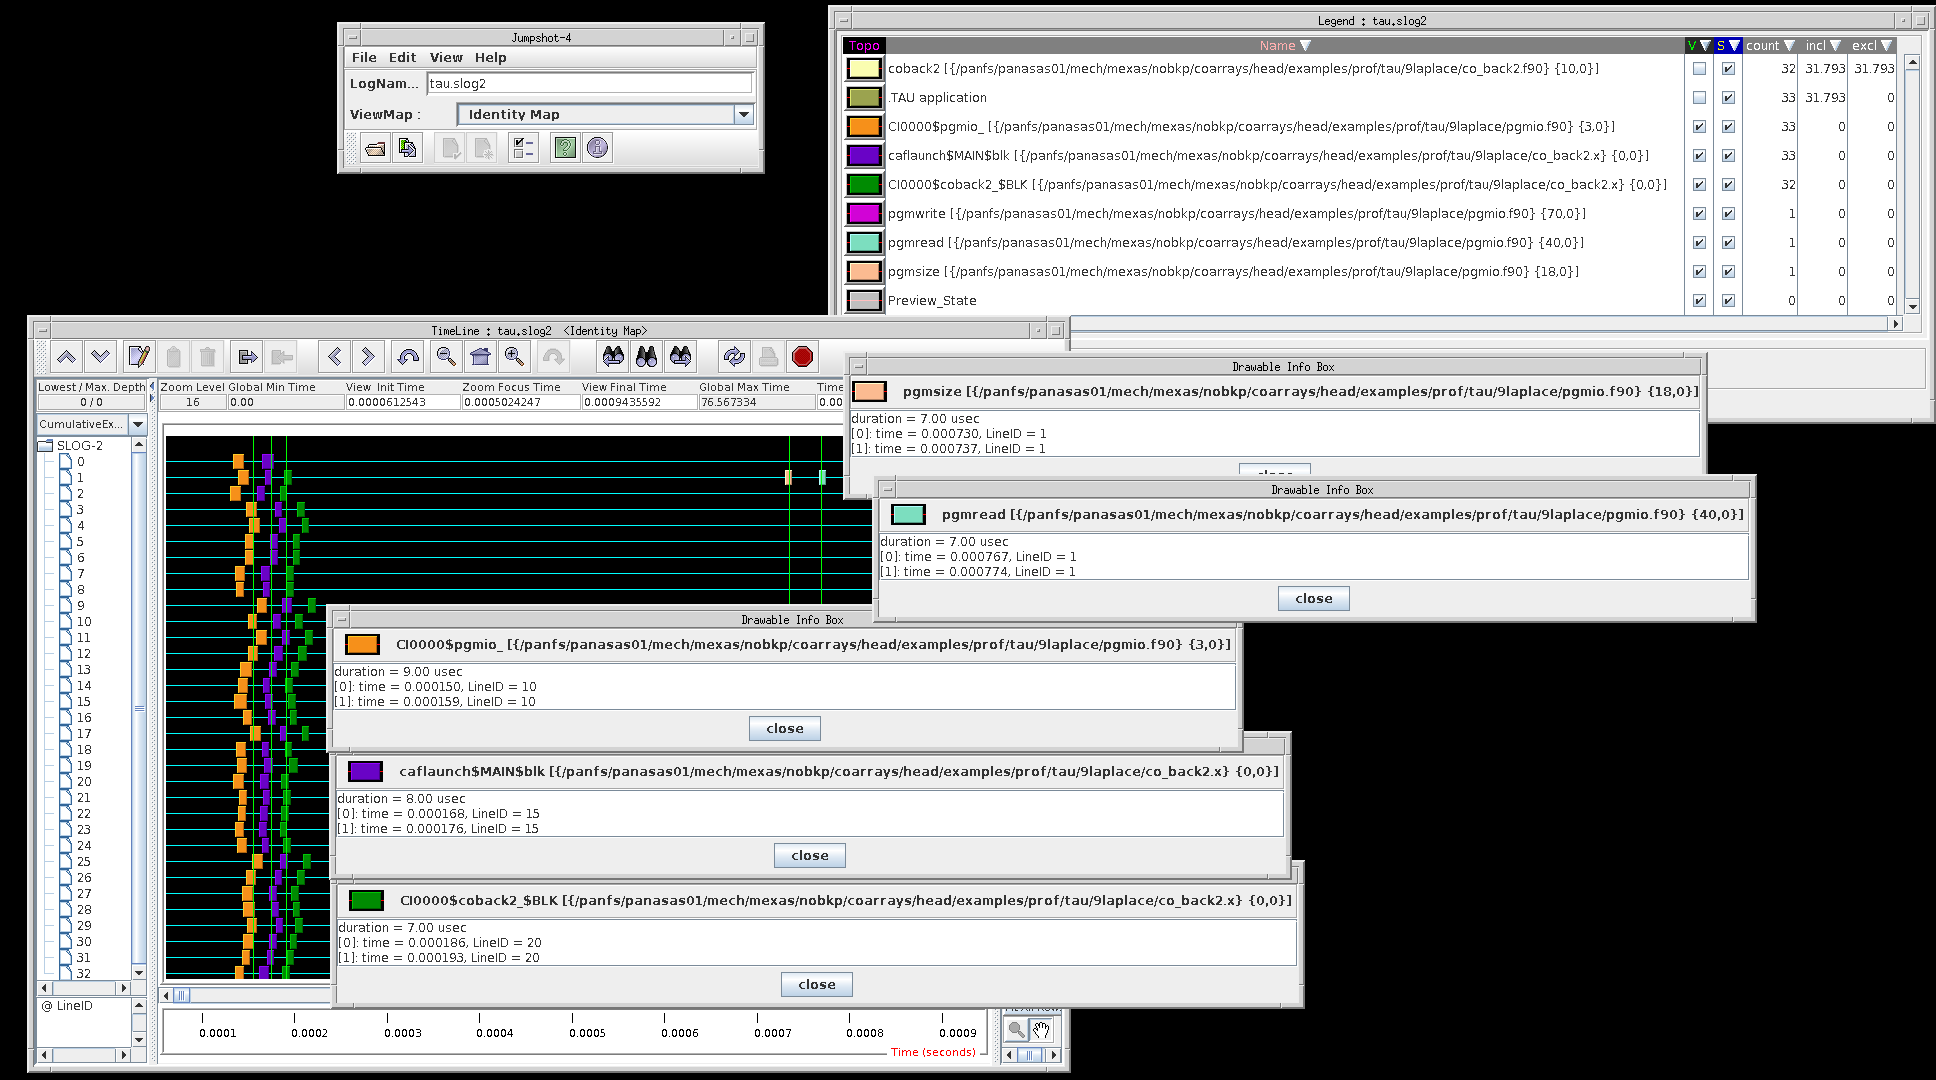
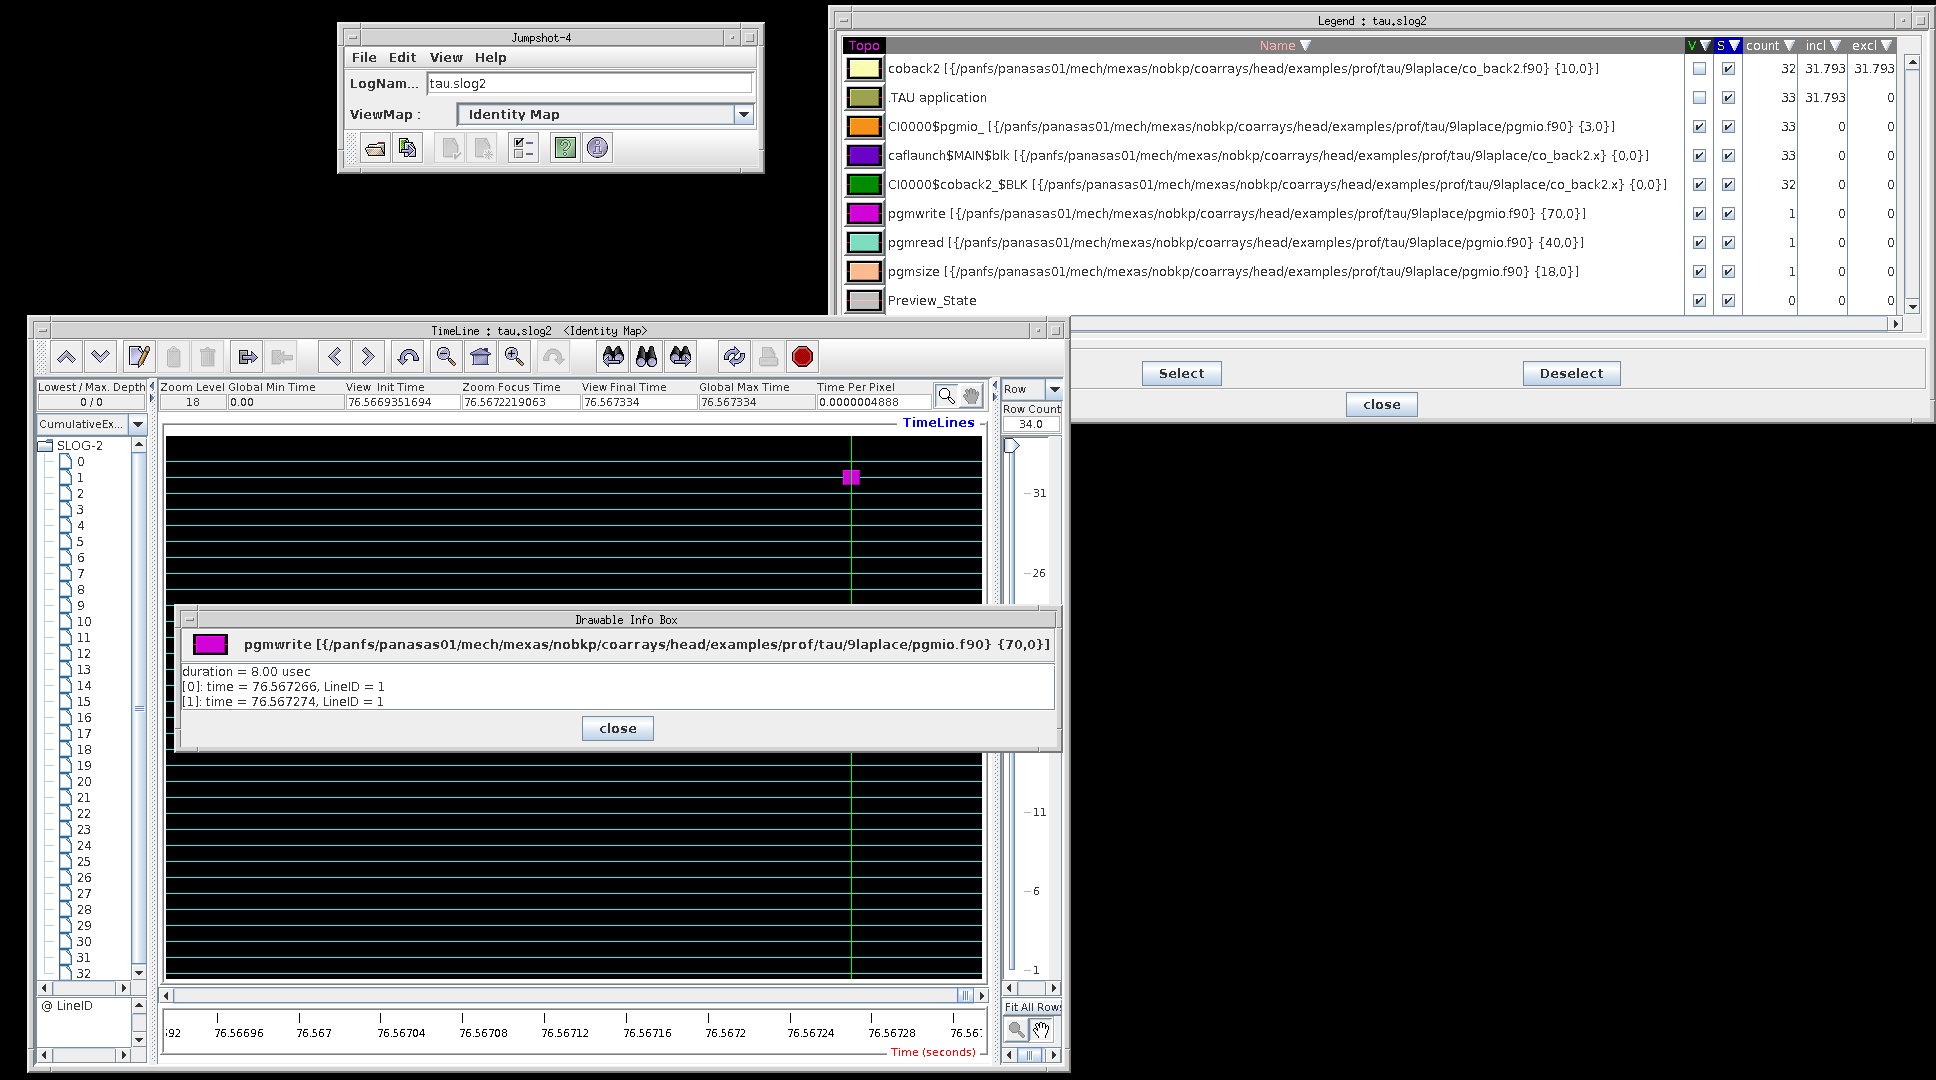
Here I show the very end of the trace, where
the data is written out by image 1, routine
pgmwrite.
29-APR-2016: Trying TAU 2.25.1 + PDT 3.22
Updating TAU+PDT following this announcement in [Tau-users] mailing list.
tar xf pdtoolkit-3.22.tar.gz
cd pdtoolkit-3.22
./configure -ICPC
make
make install
tar xf tau-2.25.1.tar.gz
cd tau-2.25.1
./configure -c++=icpc -cc=icc -fortran=intel -mpi -pdt=$HOME/pdtoolkit-3.22/ -papi=/cm/shared/libraries/intel_build/papi-5.3.0 -PROFILE -TRACE -slog2
make install
Make executable file, chmod 755, e.g.
parallel.sh with e.g.:
#!/bin/bash
mpirun -np 8 ./simple
and run validation as
setenv TAU_VALIDATE_PARALLEL `pwd`/parallel.sh ; ./tau_validate -v --html --table table.html --timeout 180 x86_64 > & results.html
The validation results are in
results.html
- no errors.
Trying to use TAU 2.25.1 on
5pi
coarray example.
Using 32 images.
Still no comms and very few records:
newblue2> tau_treemerge.pl
/panfs/panasas01/mech/mexas/tau-2.25.1/x86_64/bin/tau_merge -m tau.edf -e events.0.edf events.1.edf events.10.edf events.11.edf events.12.edf events.13.edf events.14.edf events.15.edf events.16.edf events.17.edf events.18.edf events.19.edf events.2.edf events.20.edf events.21.edf events.22.edf events.23.edf events.24.edf events.25.edf events.26.edf events.27.edf events.28.edf events.29.edf events.3.edf events.30.edf events.31.edf events.32.edf events.4.edf events.5.edf events.6.edf events.7.edf events.8.edf events.9.edf tautrace.0.0.0.trc tautrace.1.0.0.trc tautrace.10.0.0.trc tautrace.11.0.0.trc tautrace.12.0.0.trc tautrace.13.0.0.trc tautrace.14.0.0.trc tautrace.15.0.0.trc tautrace.16.0.0.trc tautrace.17.0.0.trc tautrace.18.0.0.trc tautrace.19.0.0.trc tautrace.2.0.0.trc tautrace.20.0.0.trc tautrace.21.0.0.trc tautrace.22.0.0.trc tautrace.23.0.0.trc tautrace.24.0.0.trc tautrace.25.0.0.trc tautrace.26.0.0.trc tautrace.27.0.0.trc tautrace.28.0.0.trc tautrace.29.0.0.trc tautrace.3.0.0.trc tautrace.30.0.0.trc tautrace.31.0.0.trc tautrace.32.0.0.trc tautrace.4.0.0.trc tautrace.5.0.0.trc tautrace.6.0.0.trc tautrace.7.0.0.trc tautrace.8.0.0.trc tautrace.9.0.0.trc tau.trc
tau.trc exists; override [y]? y
tautrace.0.0.0.trc: 24 records read.
tautrace.1.0.0.trc: 44 records read.
tautrace.10.0.0.trc: 44 records read.
tautrace.11.0.0.trc: 44 records read.
tautrace.12.0.0.trc: 44 records read.
tautrace.13.0.0.trc: 44 records read.
tautrace.14.0.0.trc: 44 records read.
tautrace.15.0.0.trc: 44 records read.
tautrace.16.0.0.trc: 44 records read.
tautrace.17.0.0.trc: 44 records read.
tautrace.18.0.0.trc: 44 records read.
tautrace.19.0.0.trc: 44 records read.
tautrace.2.0.0.trc: 44 records read.
tautrace.20.0.0.trc: 44 records read.
tautrace.21.0.0.trc: 44 records read.
tautrace.22.0.0.trc: 44 records read.
tautrace.23.0.0.trc: 44 records read.
tautrace.24.0.0.trc: 44 records read.
tautrace.25.0.0.trc: 44 records read.
tautrace.26.0.0.trc: 44 records read.
tautrace.27.0.0.trc: 44 records read.
tautrace.28.0.0.trc: 44 records read.
tautrace.29.0.0.trc: 44 records read.
tautrace.3.0.0.trc: 44 records read.
tautrace.30.0.0.trc: 44 records read.
tautrace.31.0.0.trc: 44 records read.
tautrace.32.0.0.trc: 44 records read.
tautrace.4.0.0.trc: 44 records read.
tautrace.5.0.0.trc: 44 records read.
tautrace.6.0.0.trc: 44 records read.
tautrace.7.0.0.trc: 44 records read.
tautrace.8.0.0.trc: 44 records read.
tautrace.9.0.0.trc: 44 records read.
